Reflections on the 2024 Election: Successes, Challenges, and Lessons Learned

Intro
You’ve heard it from us before—we’re not fortune tellers. While everyone expects us to predict the future, we’ll be the first to admit it’s impossible. What we can do, however, is tell you what’s most likely to occur based on relevant data. We base our predictions on reliable current and historical data combined with a deep understanding of voting behavior—not on wishful thinking or echoing popular beliefs. While we sometimes miss the mark, we often get it right. Before this election cycle, we’ve only missed 1 race out of 45 giving us a 97.7% historical accuracy. Unfortunately, with the 2024 Presidential election, we fell short. Why? Without the final statistics being released, it’s tough to pinpoint exactly, but we’ll explore all relevant possibilities in this analysis.
Performance Statistics (Estimated)
To start with the challenges—I’ll break down our accuracy from two perspectives: 1) polling accuracy and 2) prediction accuracy. Regarding the Presidential race, both fell short compared to past performance. In terms of accuracy, we missed all five of our Presidential state calls (two states were labeled as a toss-up). While still below our standards, our polling accuracy performed notably better, with 6 out of 7 swing states landing within the margin of error.
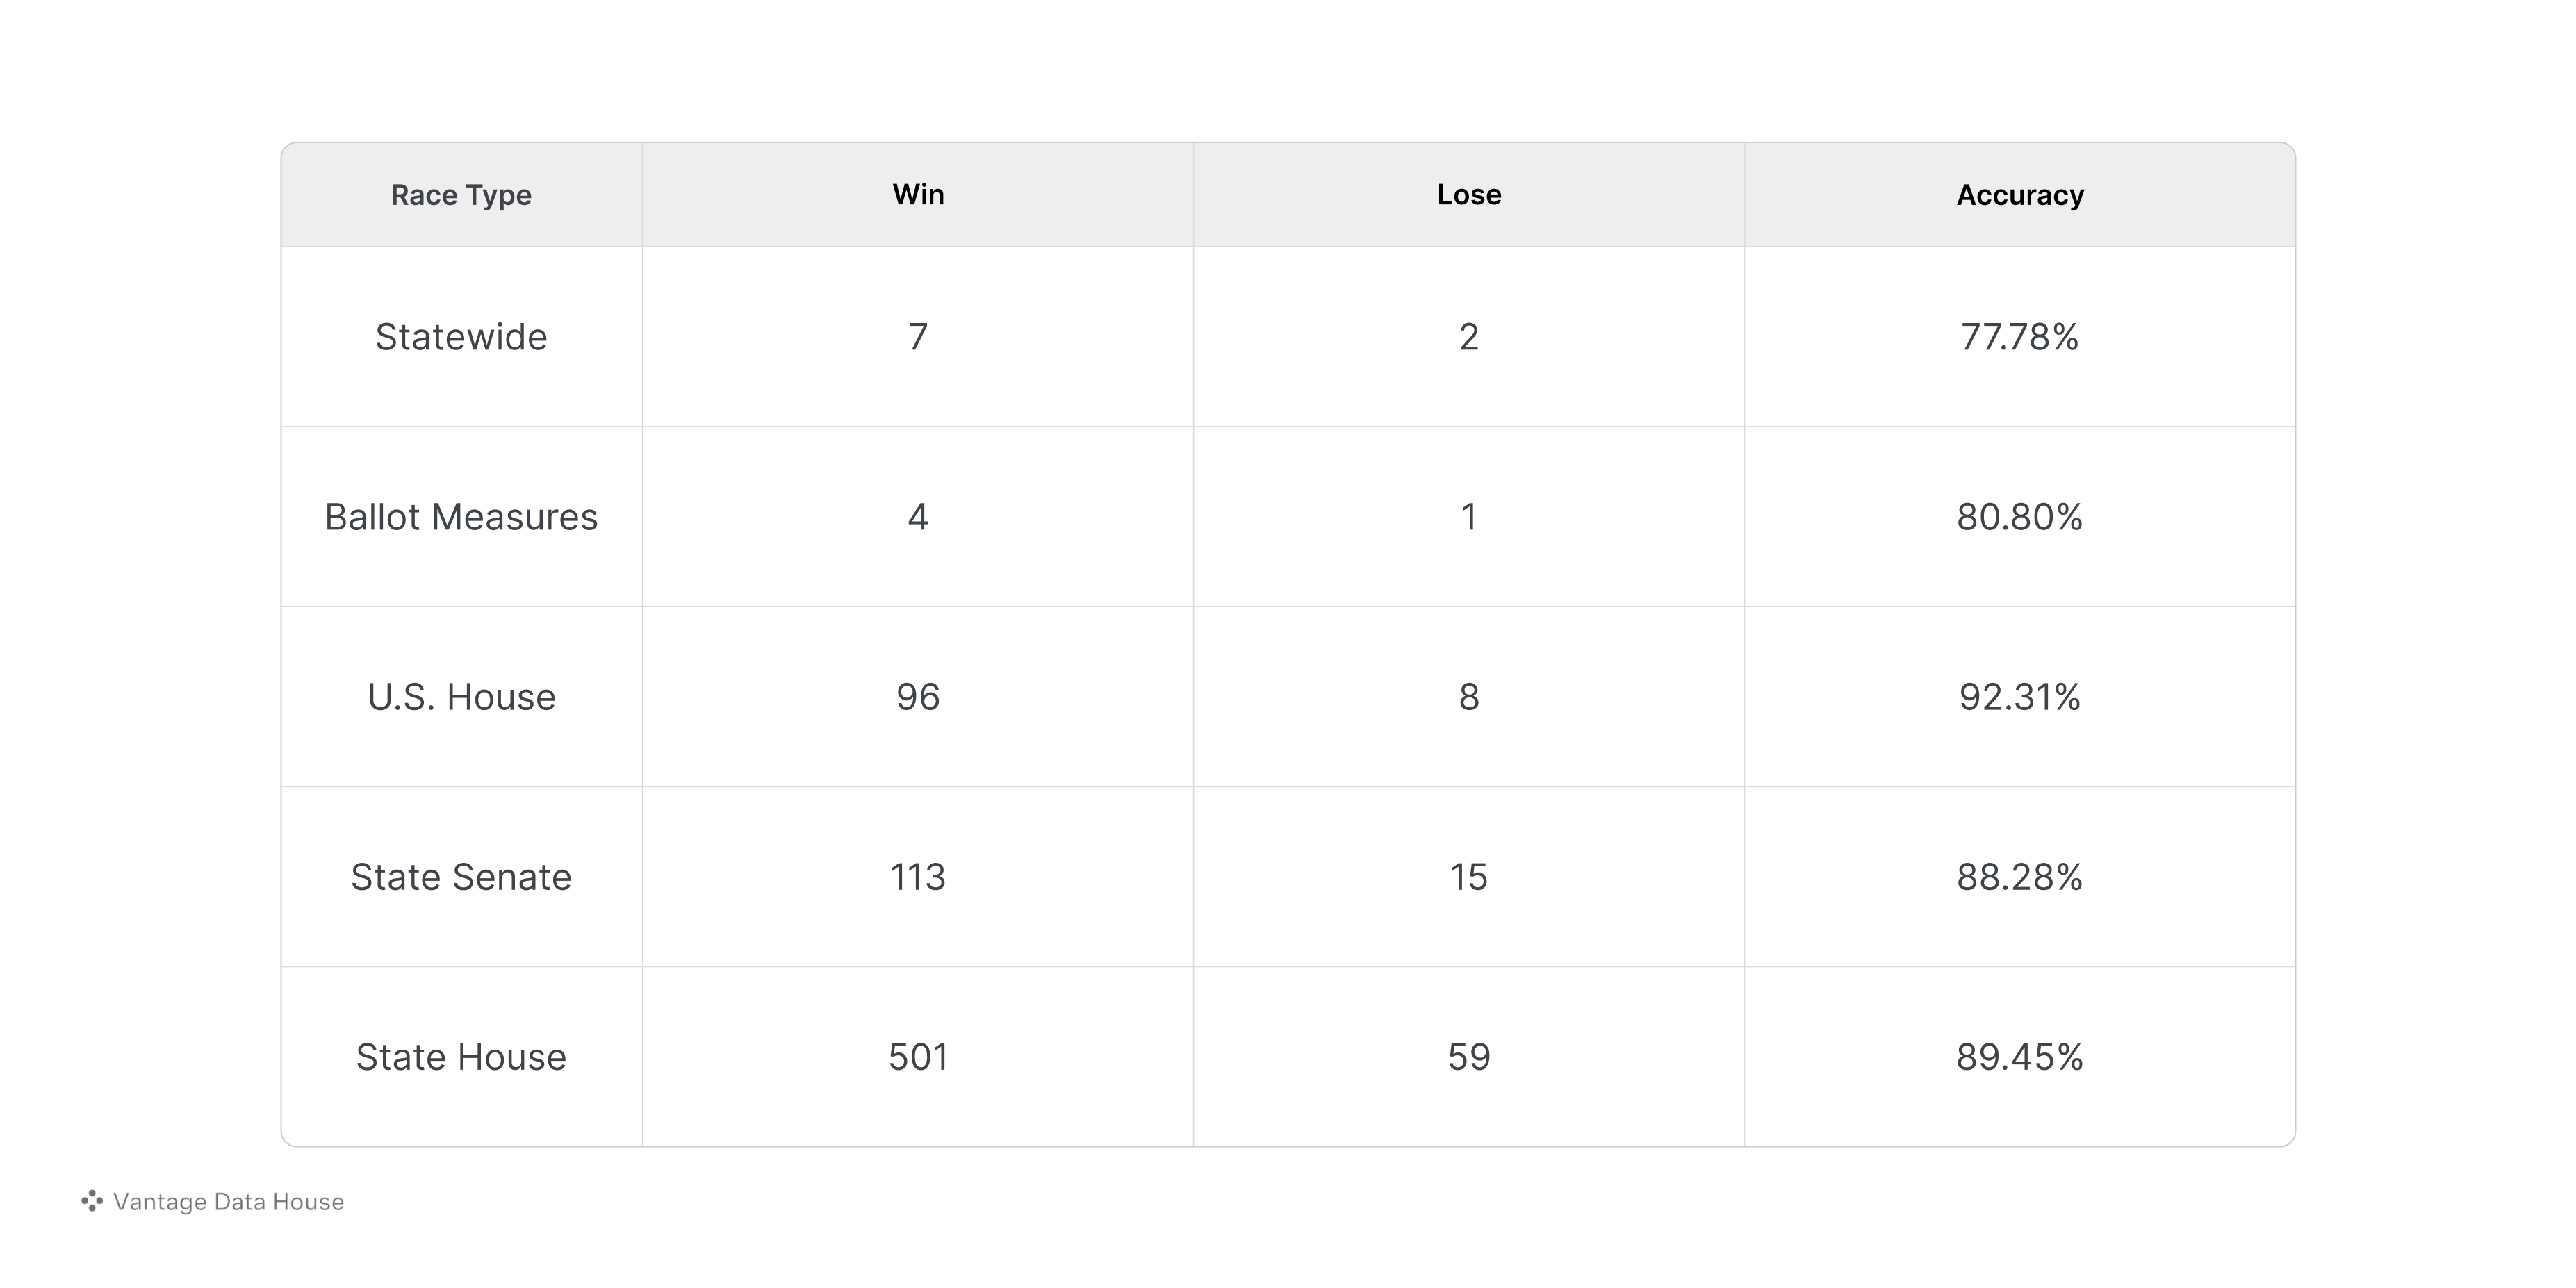
Now, for some positives—we made 9,401 predictions on candidate performances across various regions and 1,500 predictions on election outcomes. The Presidential race accounted for just seven of these. Despite our challenges in the Presidential race, we accurately predicted over 95% of candidate performances across various regions and over 90% of our election outcomes (estimated, as not all votes have been tallied and statistics released). So, while we may not be the fortune tellers everyone expects that’s pretty darn close!
Here are some stats on the most important races:

Factors Behind the Presidential Race Miss
So why did we perform well down ballot but miss the mark on the Presidential race? In summary, four key reasons contributed to our outcome. While some factors were more prominent in certain states and less in others, it was likely a combination of all four factors, varying in extent by state:
1. Turnout Models: The core challenge of being a pollster is accurately predicting voter turnout—essentially determining who will show up on election day. We base our predictions on historical election trends to estimate the proportions of Republicans, Democrats, independents, and other factors such as age, gender, education, and race. Even small inaccuracies can skew the data. This aspect of polling is the most challenging, especially when a historic event occurs, like an unprecedented surge in Republican turnout, leading to significant misses because there’s no prior precedent to account for it.
2. Sampling: Our target population consists of likely voters—those we predict will show up on election day. On November 5th, however, a significant number of unlikely voters turned out to vote. Because there is no historical data suggesting they would vote, these individuals were not captured in our projections. We estimate that at least 2% of voters in each state were unlikely voters who only cast a ballot for the U.S. Presidential race and left without voting down-ballot. This explains, in part, why it did not significantly impact our down-ballot races. For example, our down-ballot Governor prediction accurately forecasted that Stein would beat Robinson by 14.7 points, with the actual election result being a 14.6-point win for Stein. The 2% differential in the Presidential race had a substantial impact on the outcome.
3. The Trump Effect: Polling Trump accurately remains extremely challenging. This was our first presidential election cycle, and our previous experience involved missing just one race over two years. I admit I was overconfident and underestimated how uniquely different Trump would be. That said, I do not believe in the "shy Trump voter" phenomenon, where people are afraid to disclose their support. Instead, I suspect that strong Trump supporters may have deliberately misrepresented their voting intentions due to distrust of polls. For example, we saw an excessive number of supposed Republican voters indicating support for Harris in states like Florida and Nevada, with discrepancies reaching as high as 12%. Realistically, it was likely closer to 3-5%, leading to a 4–6-point differential in Florida.
4. Nonignorable Nonresponse Error: The margin of error applies only to polling errors within a truly random sample, which assumes that every participant has an equal probability of responding—something that rarely occurs in practice. Lower response rates introduce non-probability sampling, reducing randomness and making the sample less representative of the broader population. Essentially, when response rates drop, the characteristics of those who choose to respond can differ systematically from those who do not. For instance, during early voting, our response rates dropped significantly as Harris surged in our polls, likely due to voter fatigue from being contacted multiple times daily. As a result, our respondents tended to be more politically engaged than the general population of likely voters, skewing our sample and potentially introducing a nonignorable nonresponse error.
The Way Forward
There are small fixes for each of these problems, but one major solution stands out: modeling. In short, our methodology can be broken into two groups. Our statewide polls are like any other traditional poll, while our down-ballot races, such as U.S. House, State House, and State Senate, use our APP modeling methodology. Statewide polls are susceptible to the full effect of these errors, relying heavily on human analysis. Even with knowing this, it is incredibly difficult to foresee every angle—hindsight is 20/20. However, our models down-ballot significantly minimize these errors by capturing hierarchical structures, improving representativeness, and reducing bias. They capture complex relationships and dependencies within the data, reducing nonresponse bias and providing more accurate predictions, even for underrepresented segments of the population. Our models effectively “fill in the gaps” using probabilistic methods and comprehensive voter data, correcting deviations from true randomness.
For context, the 2024 Presidential race reflects a situation we encountered during the 2023 election cycle when we missed predicting Alan Seabaugh’s win in District 31. This is the only race Vantage has ever missed out of the 45 races we’ve predicted since our start. While our models had accurately forecasted Seabaugh’s win five months prior, at the time, we chose not to rely solely on these models and implemented a different strategy. We conducted an APP model to capture voter attitudes and then followed up with a traditional in-district poll. While our model correctly predicted Seabaugh’s victory, our traditional poll missed the mark by a wide margin. This experience led us to rely primarily on our models for down-ballot races, as they have proven to be more accurate than traditional polls for the reasons outlined earlier.
I see the issue and solution now just as I did in 2023. Moving forward, I believe we should rely not only on our models for down-ballot races but also from a statewide perspective. However, this decision will be made once all relevant data from this election is released. While we can speculate on what happened, we won’t have a full understanding until we compare our turnout models to the actual turnout of the 2024 election cycle. If our speculation is correct, then although no one will need to poll Trump again, these same issues will worsen for pollsters as response rates continue to decline and mistrust in polling grows. Modeling is the future of polling, and clinging to outdated methods will only lead to less accurate results.
Conclusion
Overall, we had our share of challenges and successes. Expected when you’re trying to accomplish something that’s never done before. This experience has taught us valuable lessons that will help us create an even better product moving forward. Yes, we missed the presidential race, but we also:
1. Built the first-ever automated polling platform in just four months.
2. We conducted the equivalent of 1.2 million polls and provided this data to our members at a fraction of the cost of a single traditional poll.
3. Accurately predicted an estimated 90% of down-ballot races.
What we’ve achieved here is truly remarkable, and I’m extremely proud of what our team has accomplished in such a short amount of time.