The Blowout No One Sees Coming
Intro
Pollsters are expected to be fortune tellers. We’re often asked, “what’s going to happen in the election?” Credible pollsters’ predictions are grounded in reliable data and an understanding of voting behavior, not wishful thinking or reinforcing currently held perceptions. The current prevailing narrative about the U.S. Presidential race is that it’s tight–too close to call. The reality is this race is breaking for the Harris-Walz ticket.
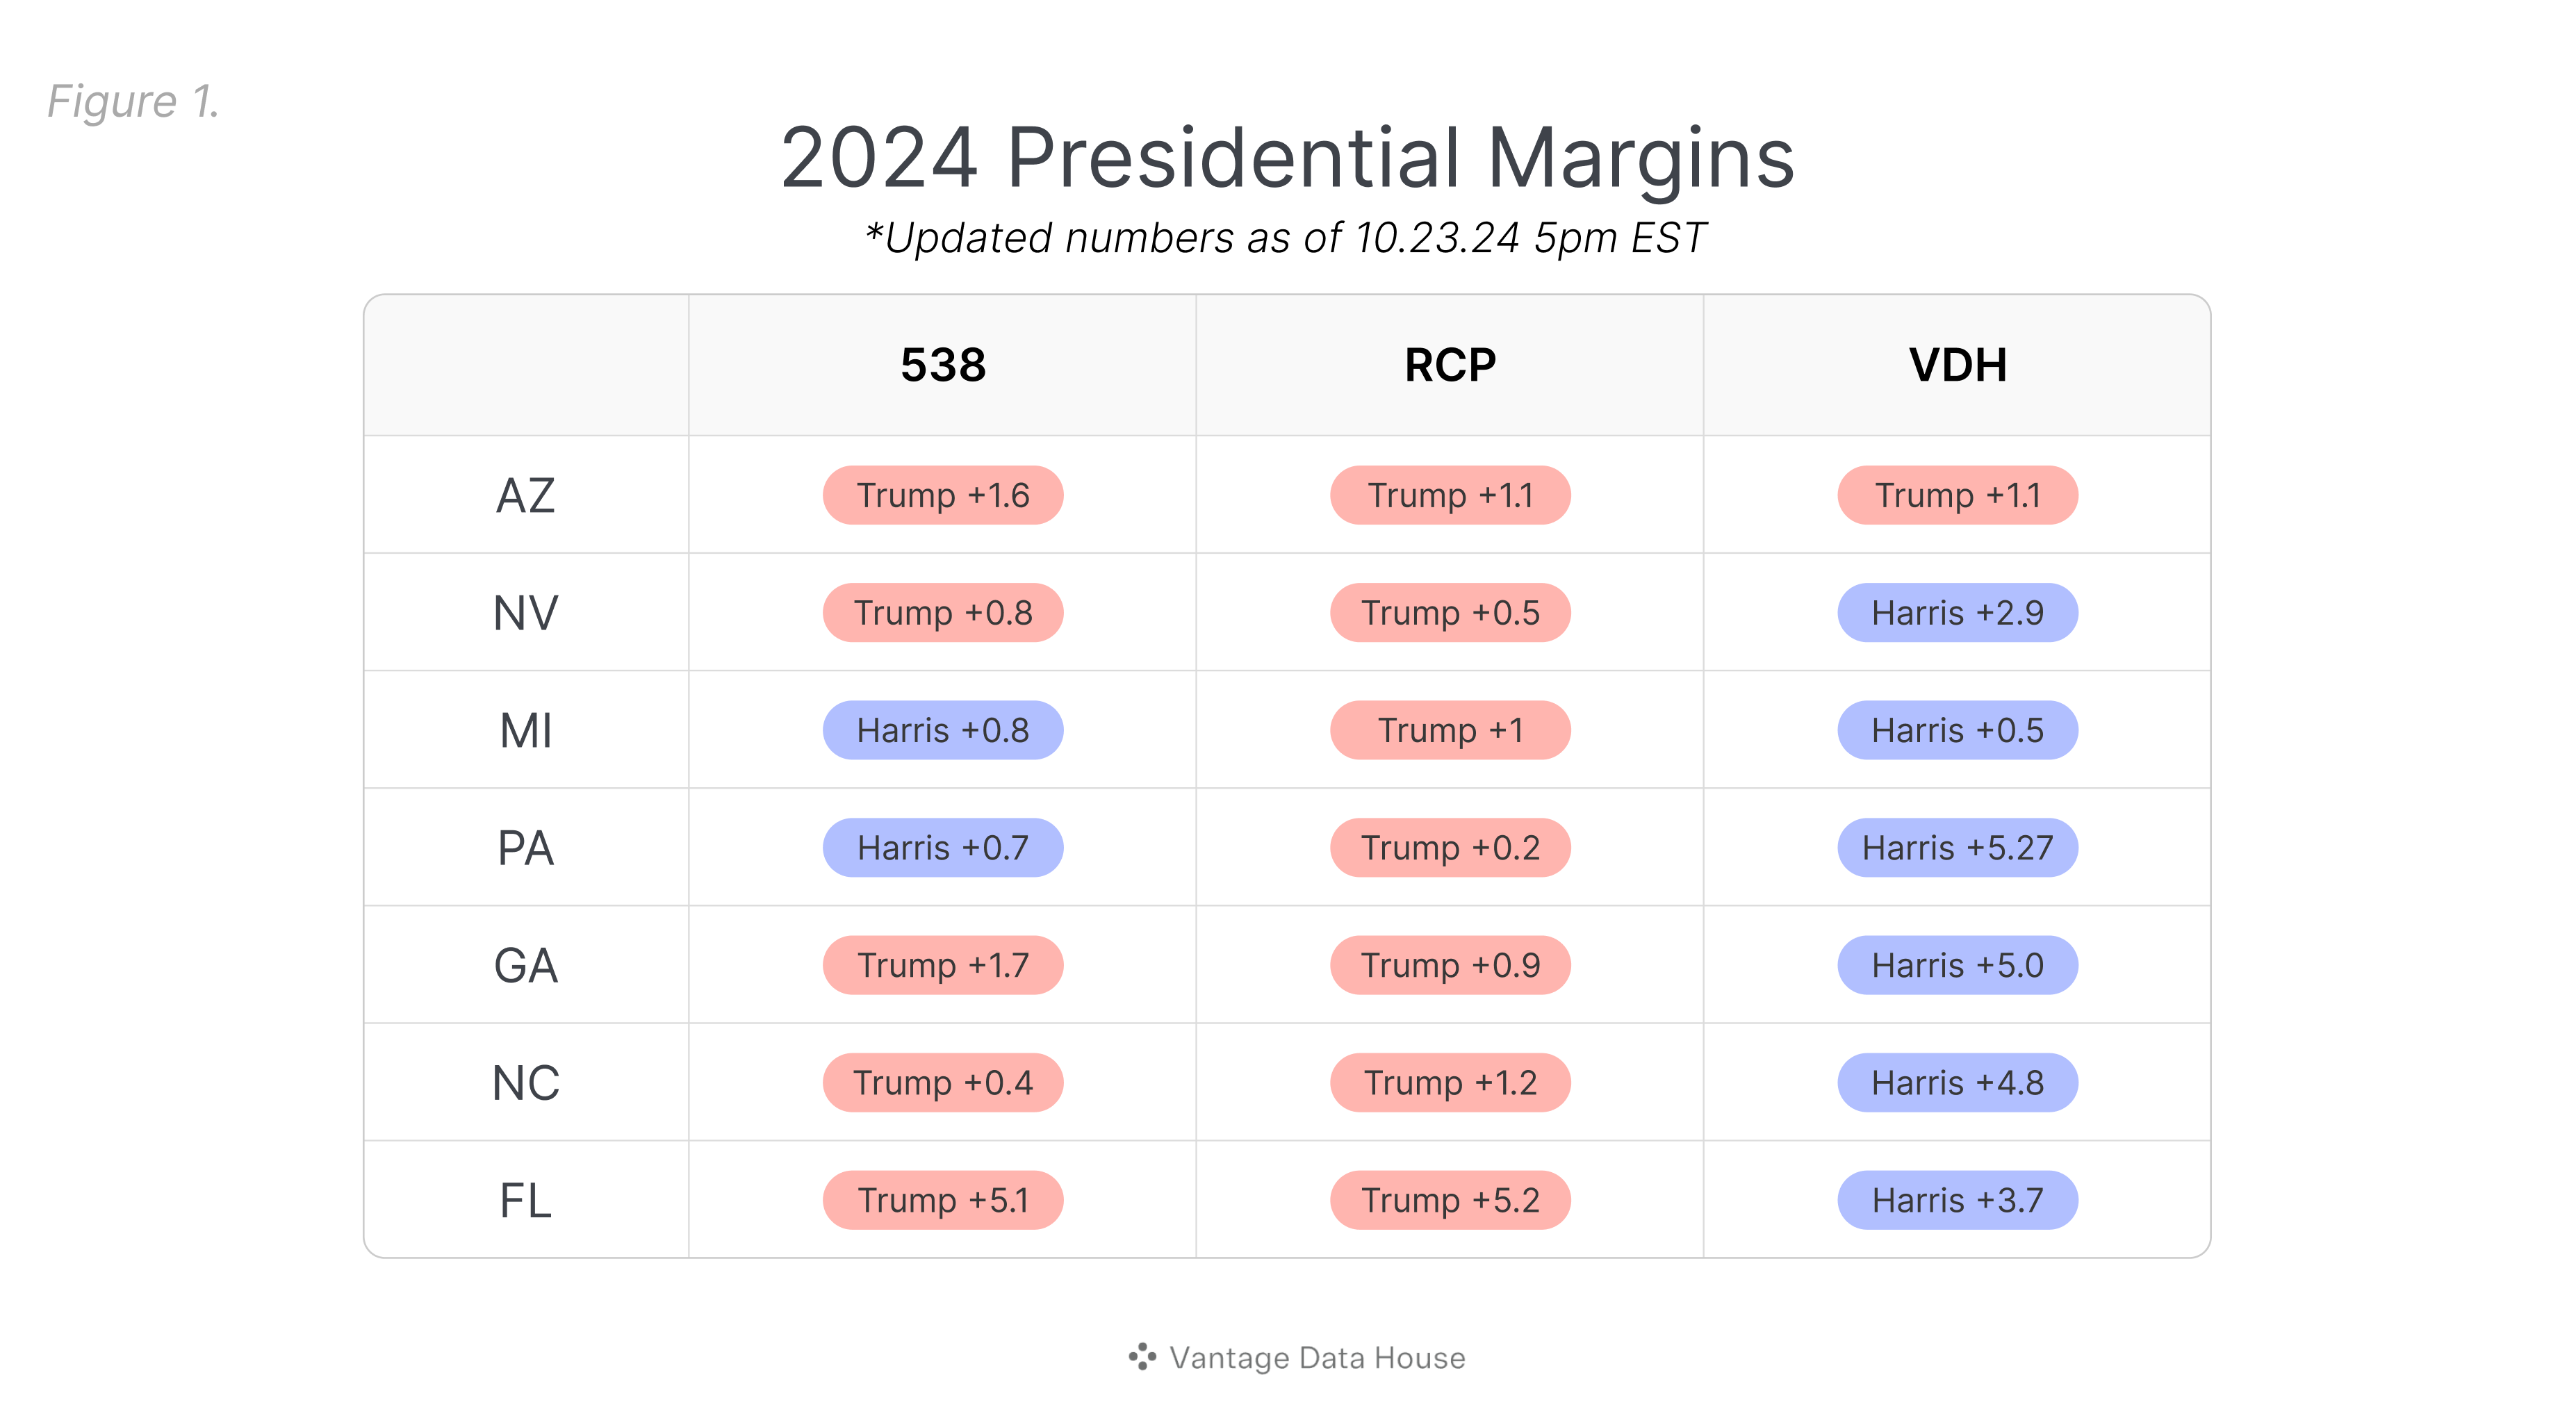
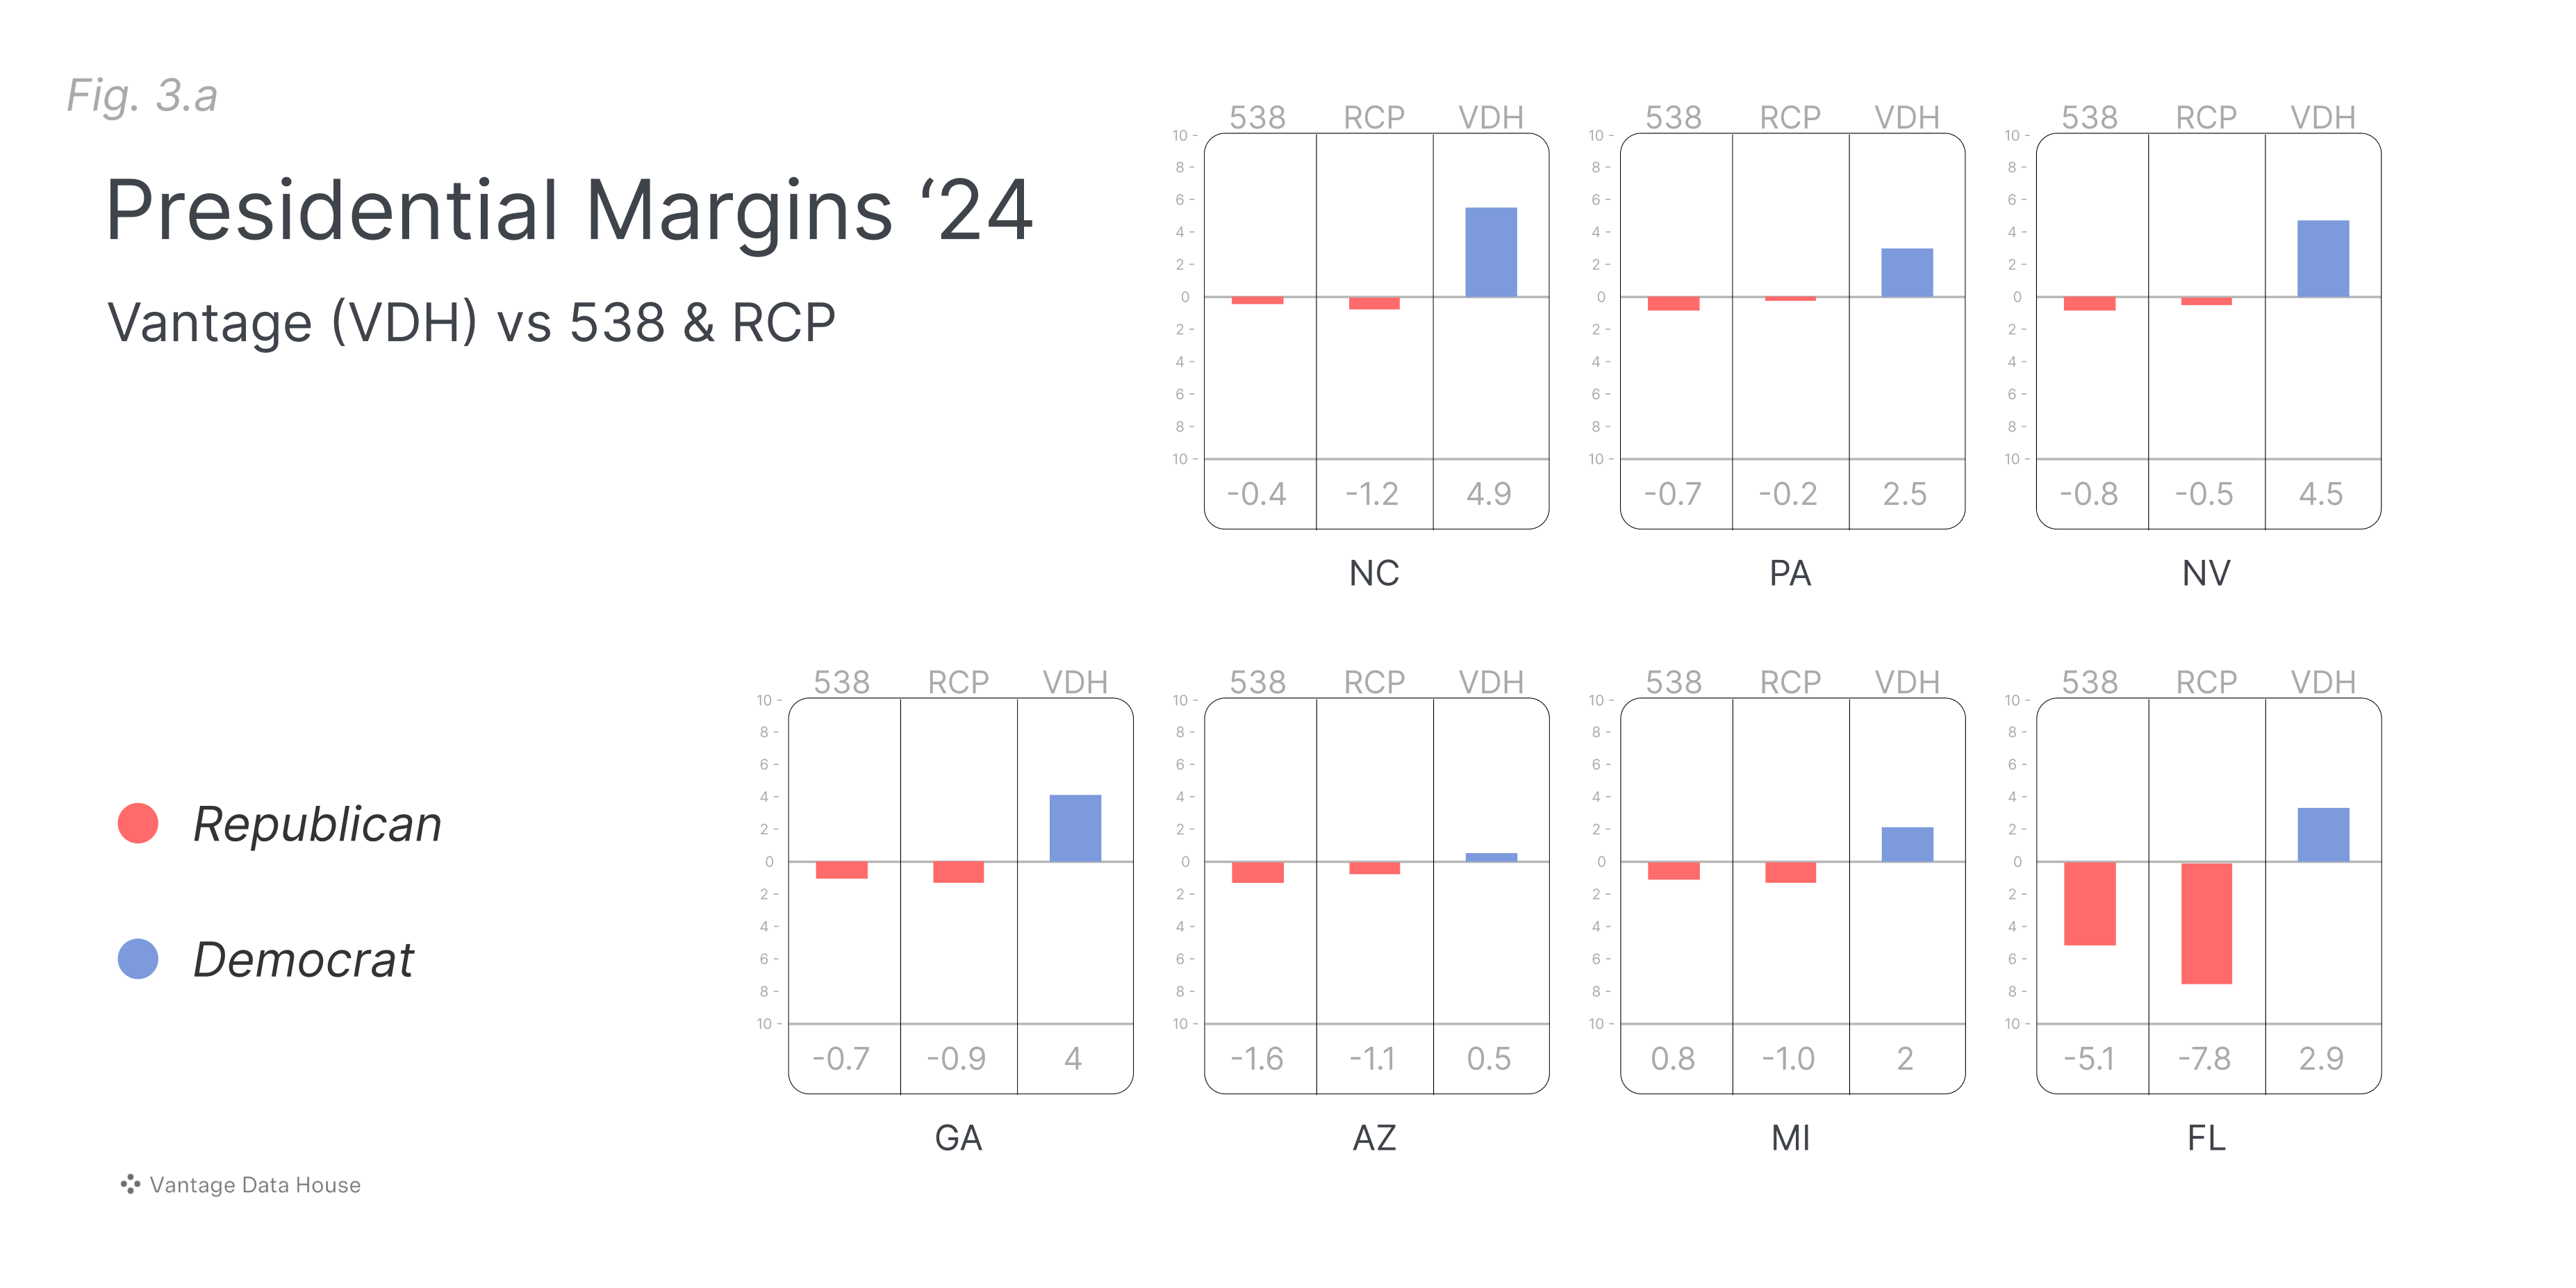
Vantage has been tracking seven swing states daily since August. Until recently, the race consistently appeared as a toss-up. Just a few days ago, the numbers started to shift. It's clear the momentum is moving away from Trump. Here's how our nightly tracking data (1,200 interviews per state) stacks up against what FiveThirtyEight (538) and RealClearPolitics (RCP) are reporting in their averages.
Noise in the Numbers: The Great Polling Mirage
Why do our numbers tell a different story than the averages? Simple: public polling is riddled with noise.
Republicans are in serious trouble, though few are willing to acknowledge it. Every major Republican Senate candidate is trailing in swing states according to leaked Senate Leadership Fund polling. Some split-ticket voting still happens, but every major Senate race is down by 5-8 points while Trump leads in the presidential polls. The math just doesn’t add up.
Let’s take a look at how our Senate numbers compare to the FiveThirtyEight (538) and RealClearPolitics (RCP) averages.
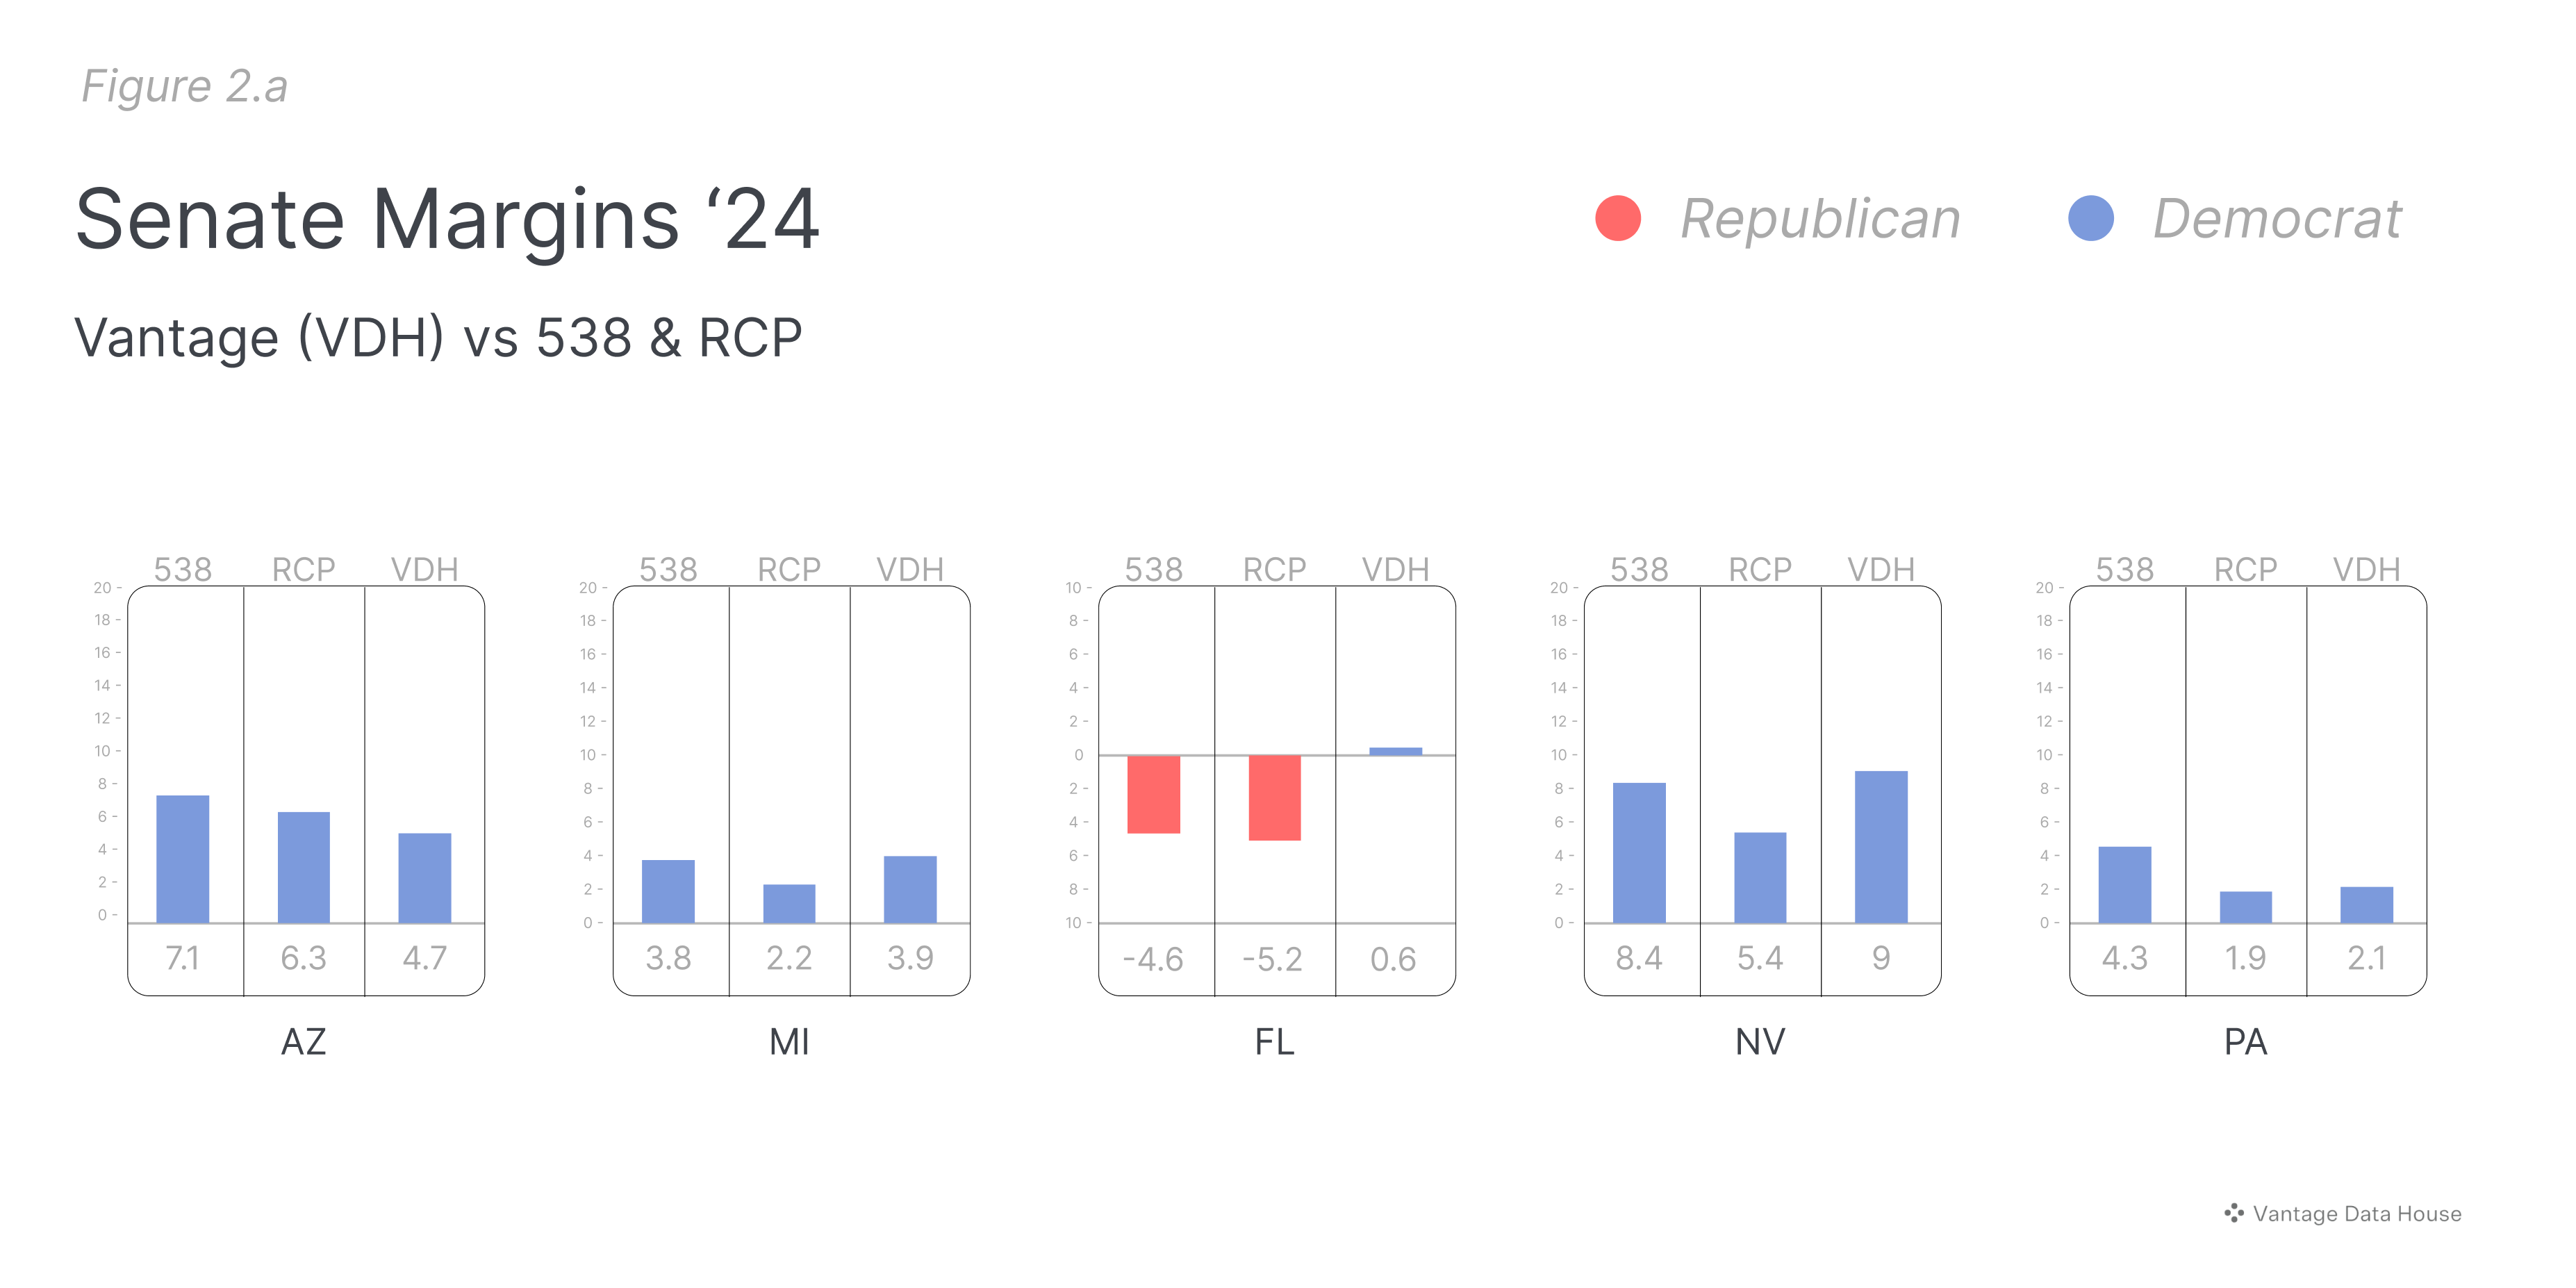
In Figure 2a, this chart shows our margin in each Senate race we’re tracking, side by side with the 538 and RCP margins. Our numbers are very similar, except for the Florida Senate race between Debbie Powell and Rick Scott. Powell overtaking Scott is a recent development in our numbers this week.
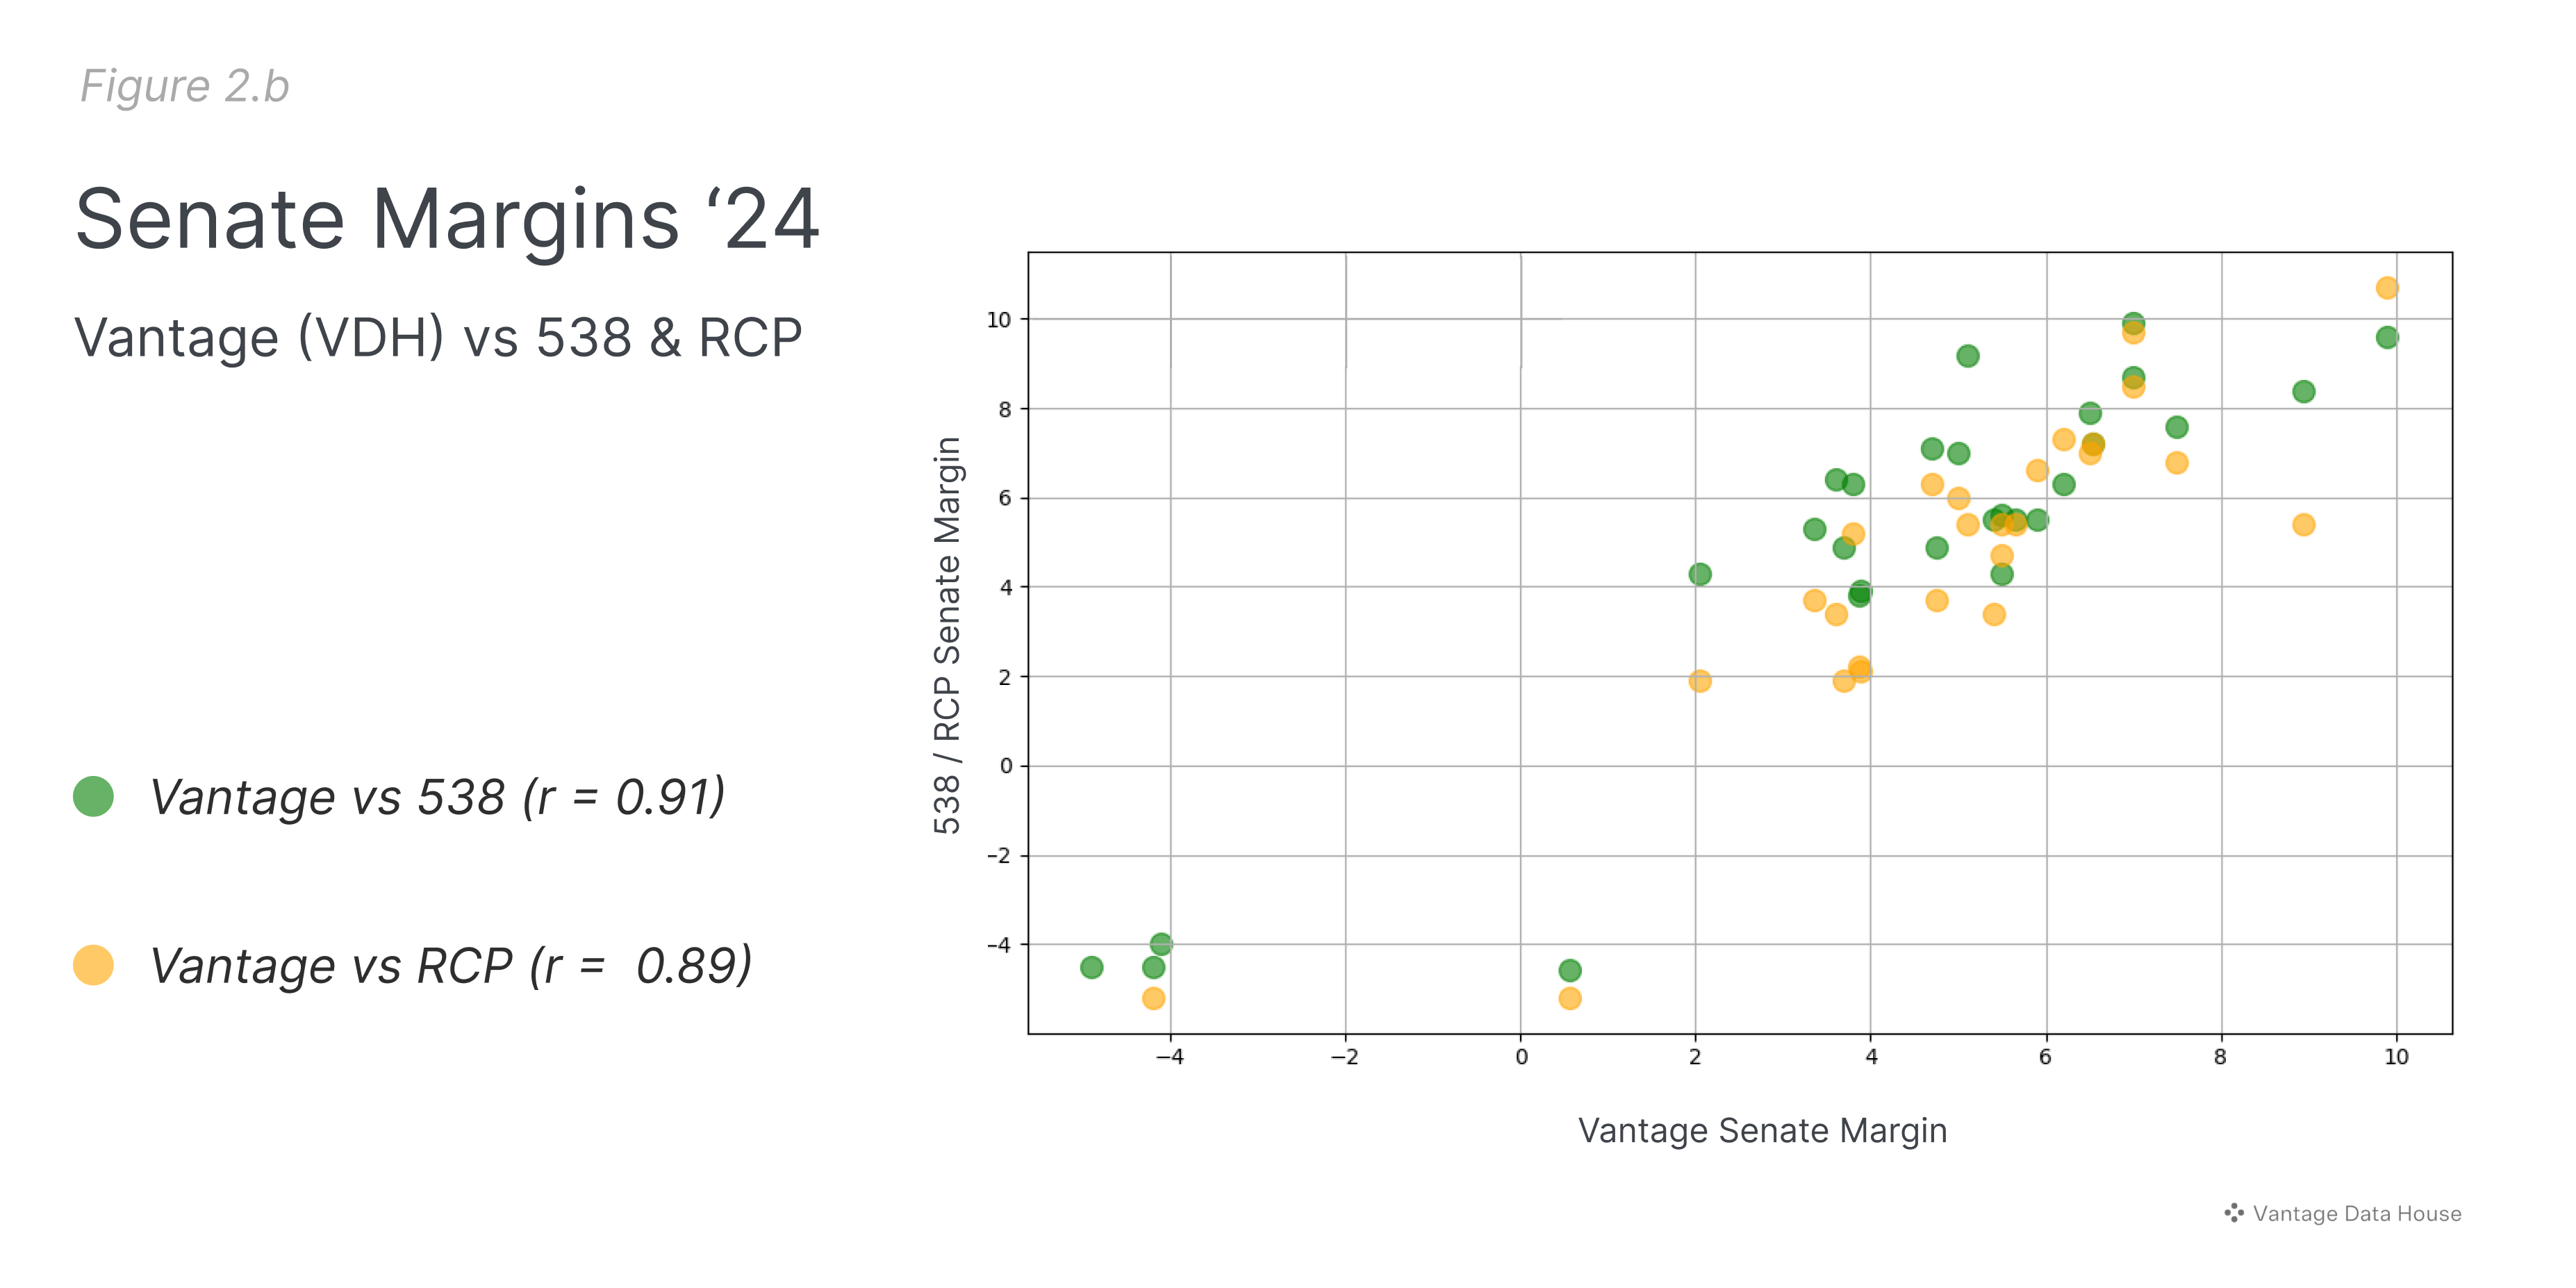
In Figure 2b, the chart highlights the Pearson correlation coefficients, which measure the strength of the relationship between Vantage’s Senate polling numbers and the averages from 538 and RCP. While Pearson correlation is typically more effective with larger datasets, we are using it here to emphasize key differences between our data and the polling averages from 538 and RCP. A Pearson coefficient close to 1 indicates a strong positive correlation, meaning that our numbers are closely aligned with theirs. In this case, our correlation of 0.91 with 538 and 0.89 with RCP shows that our Senate polling is highly consistent with these averages. This shows that our Senate numbers are in step with the majority of polling consensus.
Some point to split-ticket voting as the explanation, but that’s not the case. There have been fewer than 200 split-ticket outcomes in presidential and Senate races since 1948. Since 2016, only one split-ticket result has occurred—Biden and Susan Collins in 2020. As partisanship deepens, these split-ticket outcomes are becoming even rarer. This trend is supported by research from political scientist Gary Jacobson, who found a 0.95 correlation between presidential and Senate vote shares in 2020, showing just how interconnected these races have become.
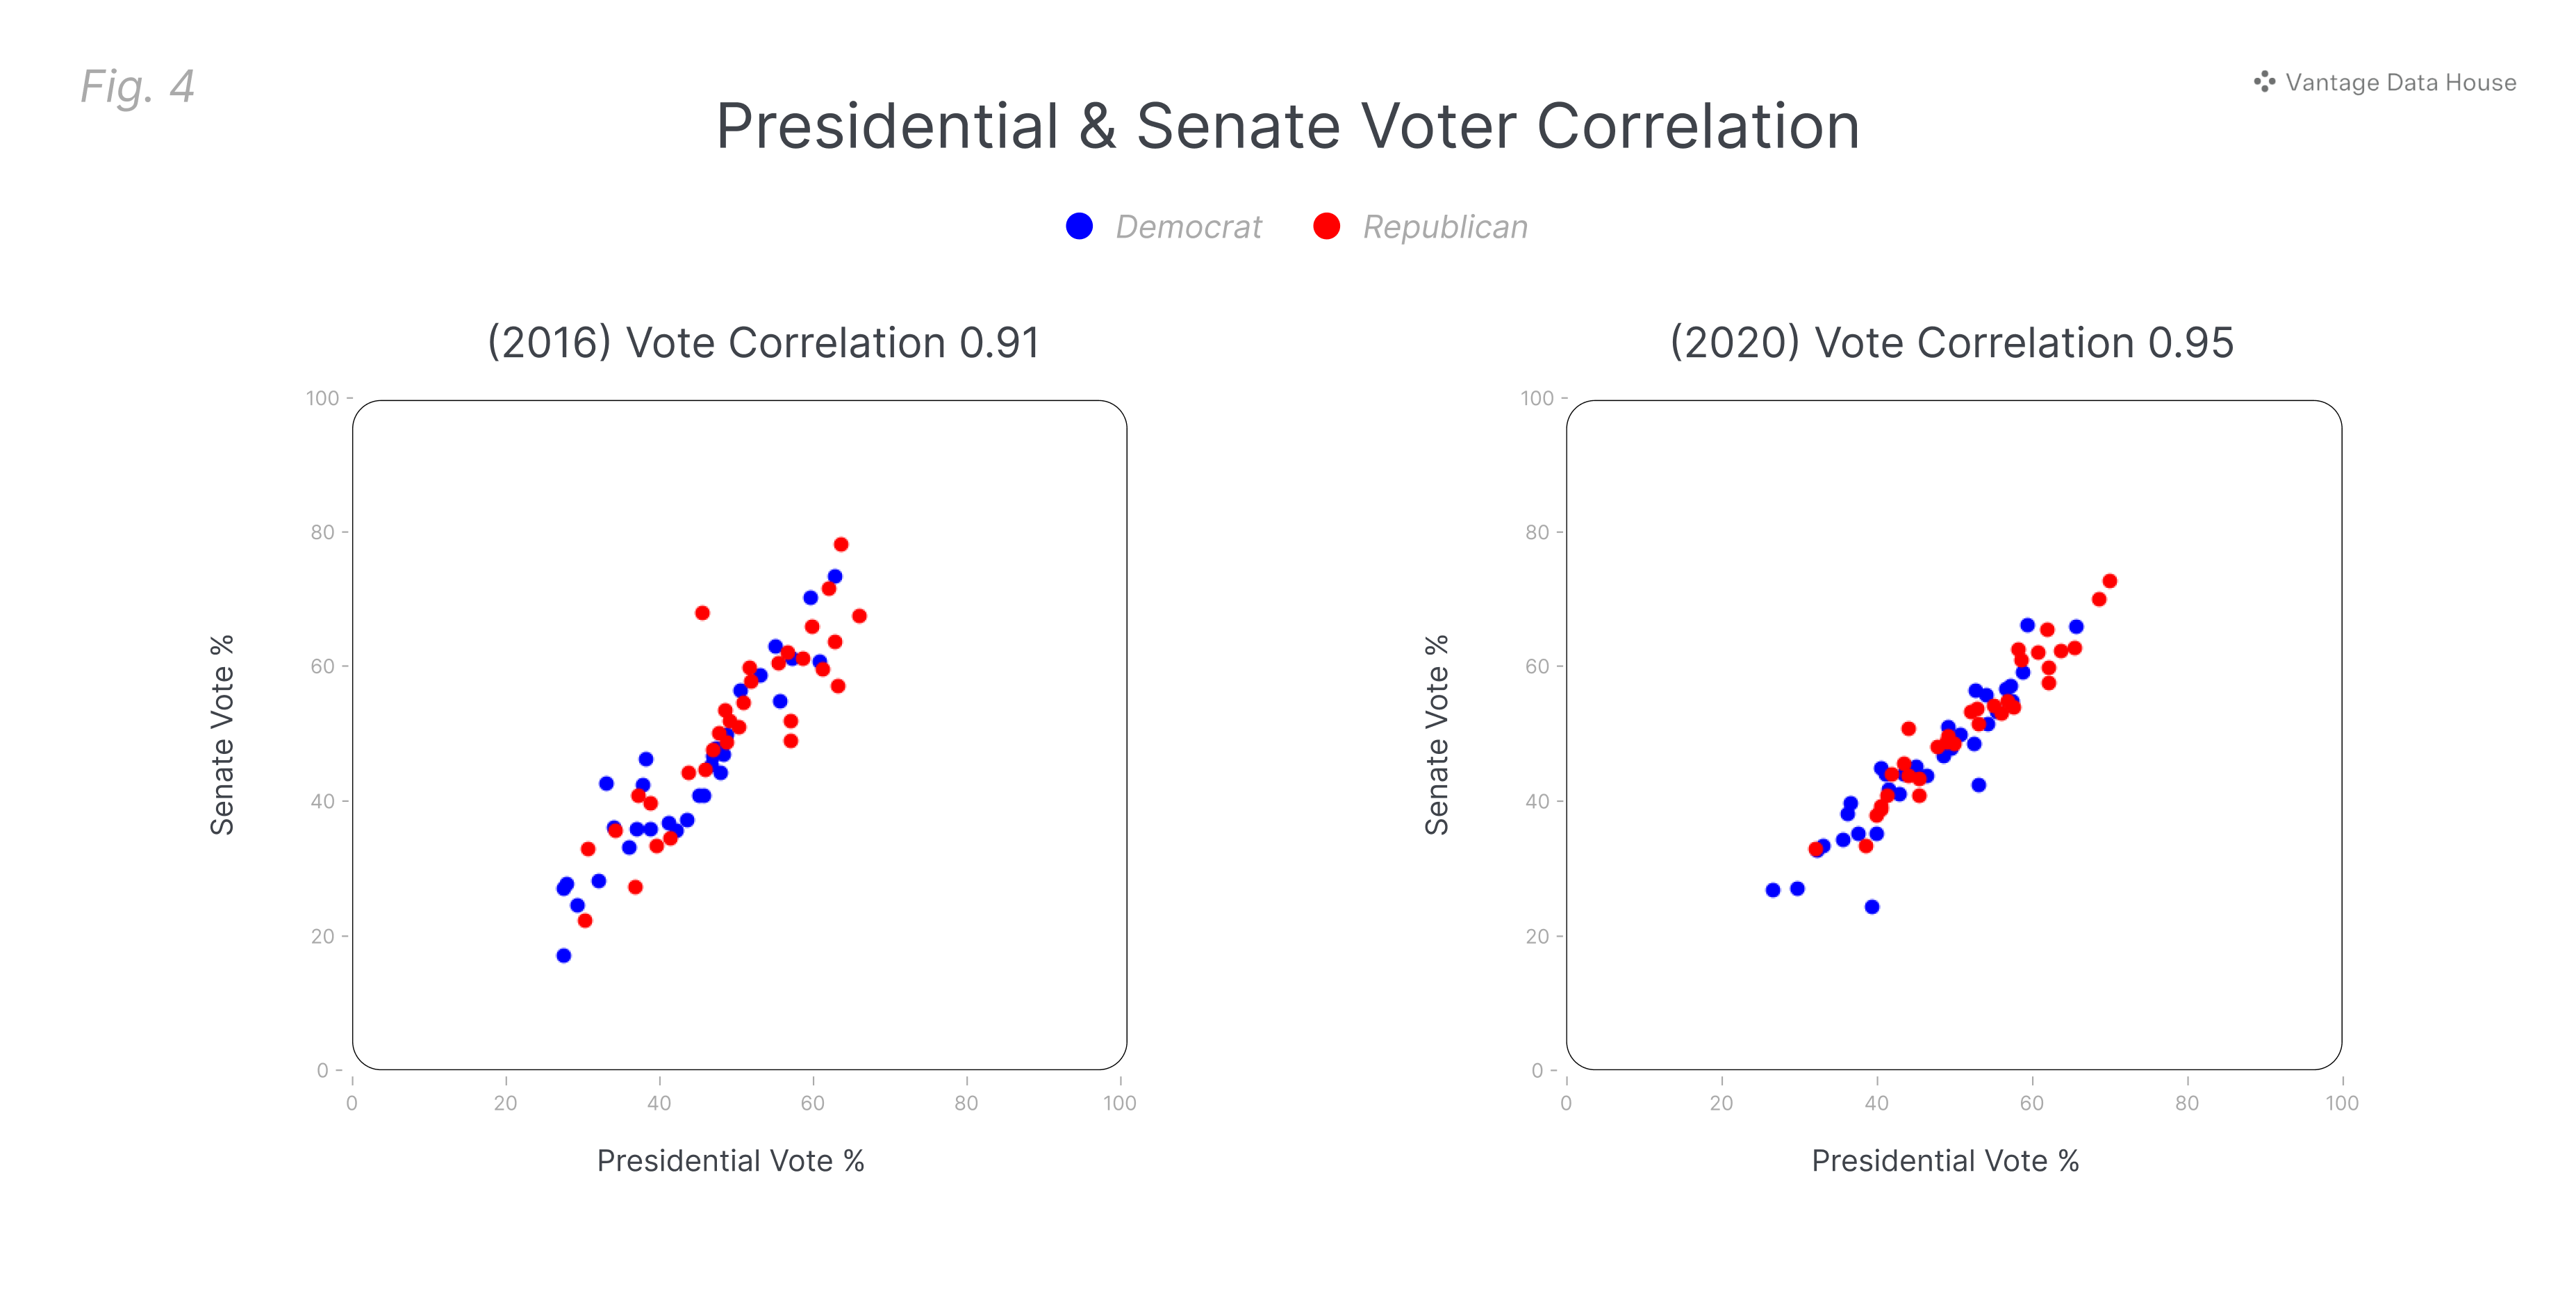
The figure above shows the Pearson correlation coefficients between presidential and Senate vote shares in 2016 and 2020. A correlation close to 1 indicates that voters are sticking to party lines in both races, while a correlation near 0 suggests more frequent split-ticket voting. A correlation of 0.91 in 2016 and 0.95 in 2020 indicates that the vast majority of voters were sticking to their party when voting in both the presidential and Senate races, leaving very little room for split-ticket voting. These high correlations show that voting patterns in those years were overwhelmingly partisan, with voters choosing the same party for both races, making split-ticket outcomes increasingly rare.
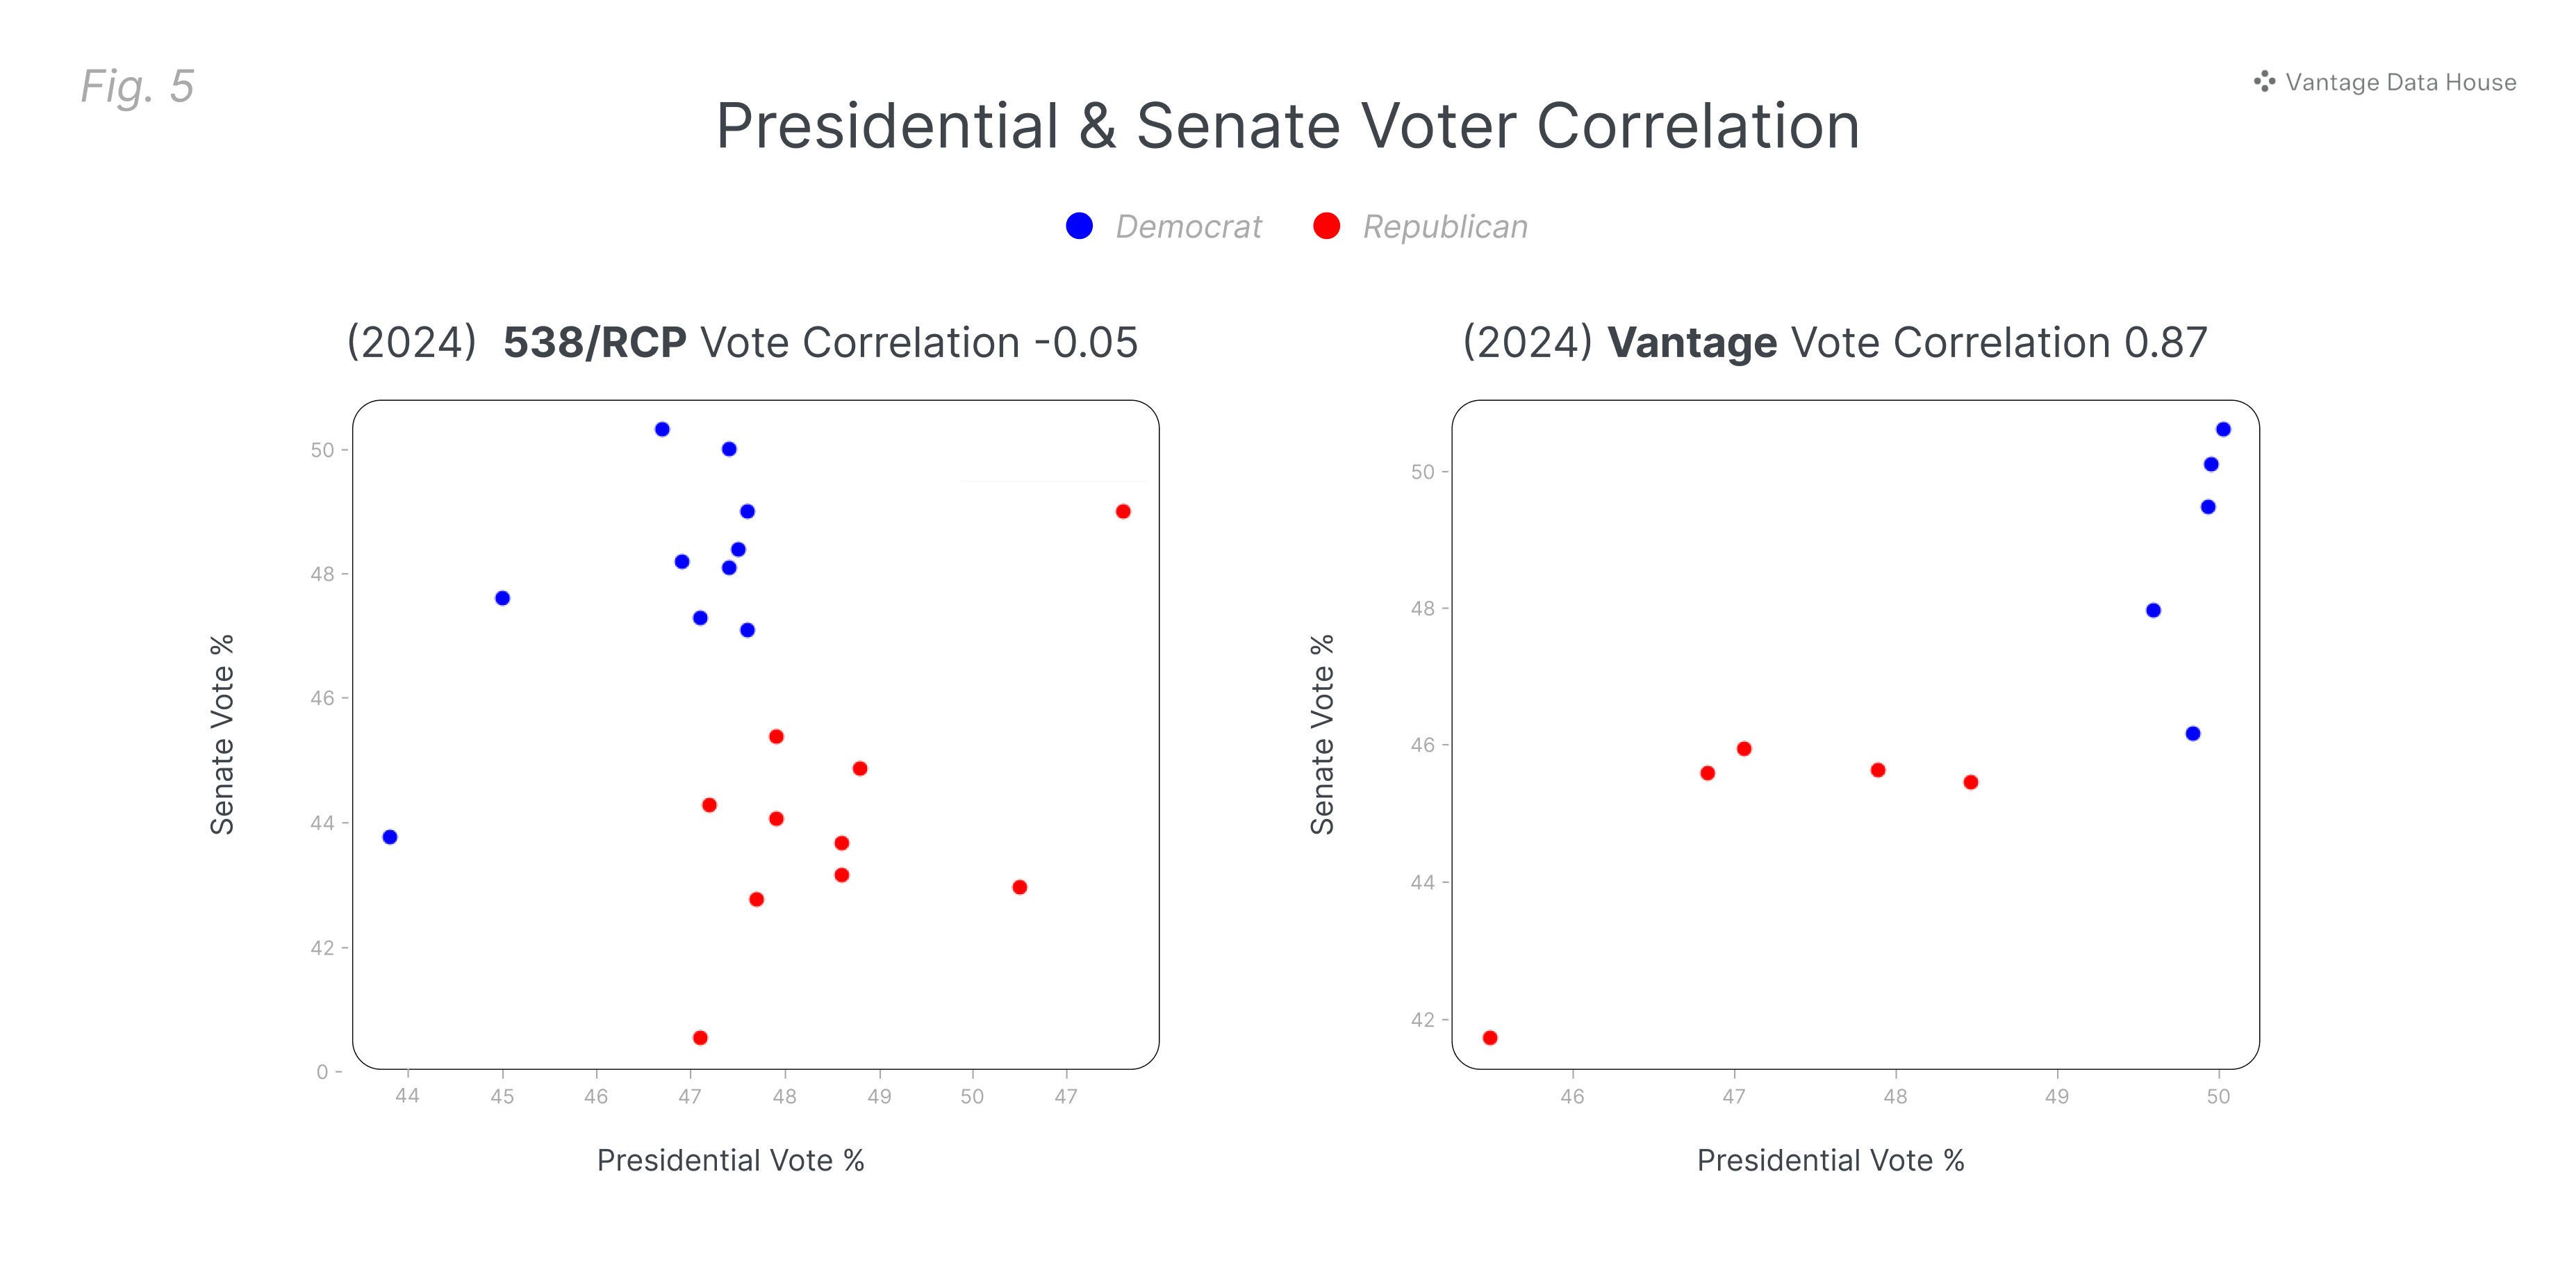
To compare the historical average correlation between presidential and Senate vote shares in 2016 and 2020, we measured it against our polling data and a combined average from 538 and RCP. Our polling data shows a correlation of 0.87, which is close to the historical norm. This suggests that our polling is capturing voter behavior in line with what we’ve seen in recent elections.
538 and RCP show a negative correlation of -0.05, which is far off the historical trend. A negative correlation suggests that their polling is showing a decoupling of Senate and Presidential voting patterns, meaning a high amount of split ticket voting would be taking place in the swing states, which is historically very rare.
So, what do we know?
- Our Senate numbers align with the 538 and RCP averages, showing consistency.
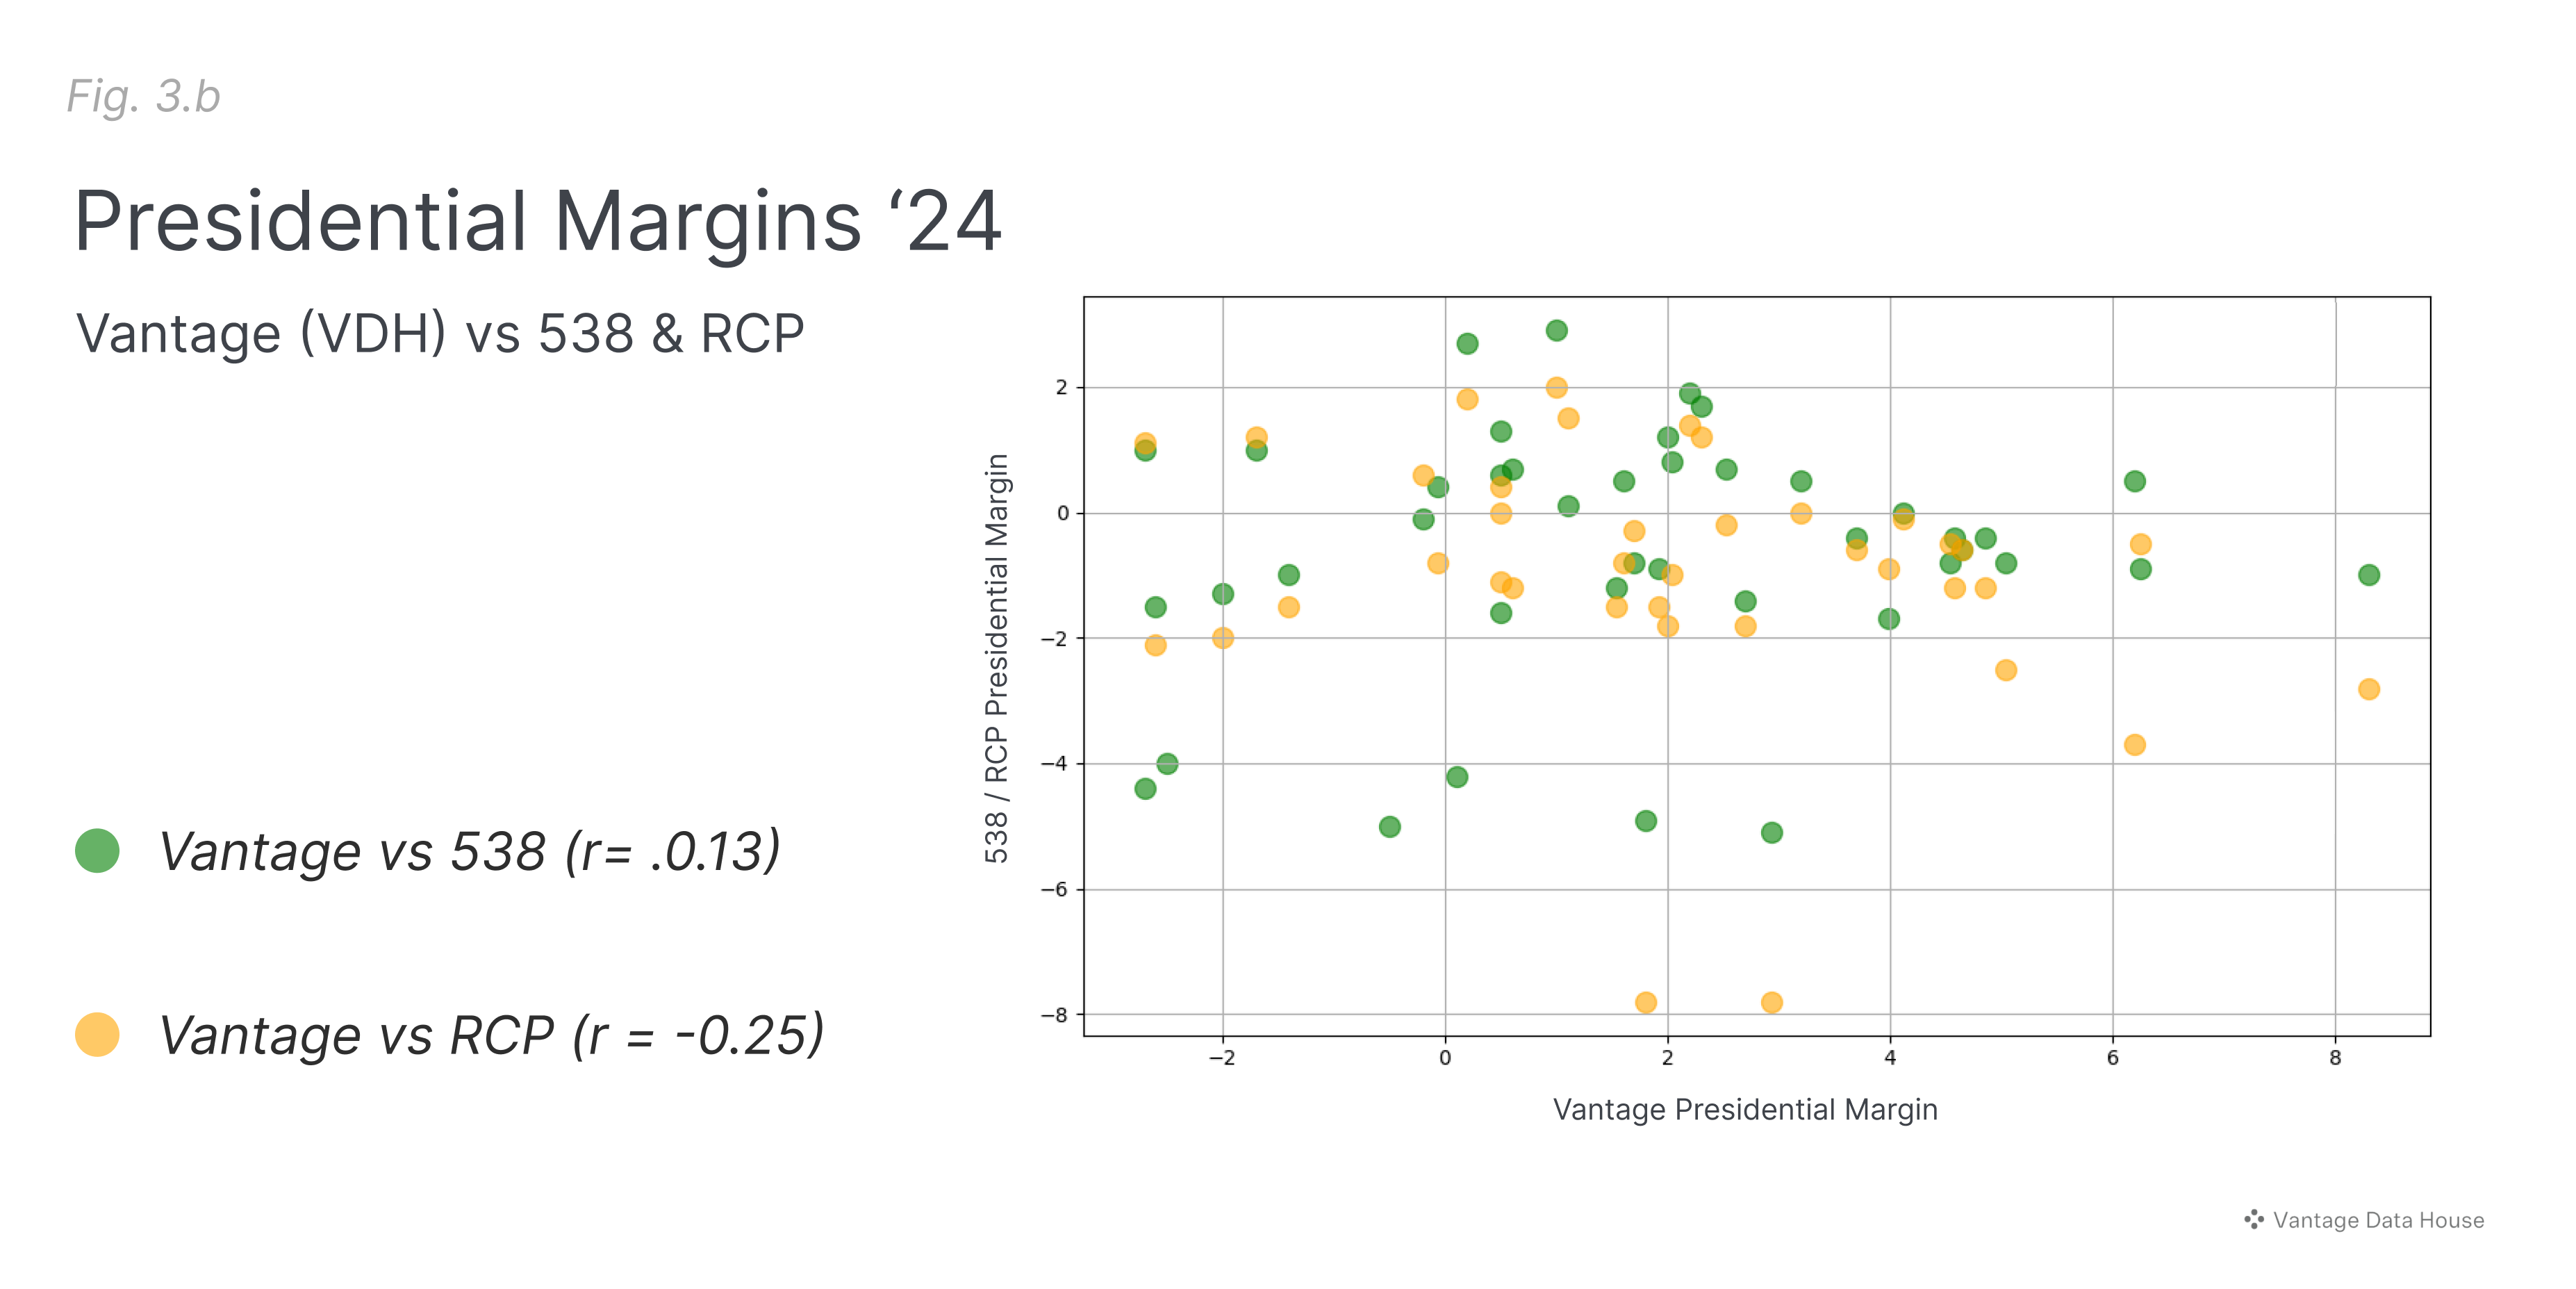
- Our presidential numbers diverged from the 538 and RCP averages.
- But our presidential/Senate numbers are highly correlated with historical voting trends, whereas the 538 and RCP averages are not.
This points to three possible explanations:
1) we're wrong, and an unprecedented level of split-ticket voting will occur in the swing states, 2) a significant portion of Trump voters remain undecided in Senate races, or 3) these averages are reflecting a significant amount of noise.
Split Ticket Theory
The split ticket theory doesn’t hold much water, especially considering the high correlation between partisanship and voter behavior. One particularly confusing case is in North Carolina where Lt. Governor Mark Robinson’s disastrous gubernatorial campaign is sinking every race on the ticket. Robinson is trailing by 22 points overall and a staggering 41 points among women. Yet, Trump is leading by 0.4-1.2 in the averages. It’s hard to imagine a Republican losing by 41 points among women while Trump is supposedly running a close race. Even without the gender gap, the idea that Robinson is down 22 points while Trump is ahead defies logic. This would be a 23% split ticket margin, which would be astonishing.
Trump Undecideds Theory
Much like the Split Ticket Theory, the Trump Undecideds Theory, doesn't hold up either. This theory suggests that the decoupling of presidential and Senate races is due to most undecided Senate voters being Trump supporters. The main idea is that their lack of familiarity with the GOP Senate candidates keeps them undecided, but on election day, they will vote for the Republican candidate.
Below is a table showing the name recognition of each Republican Senate candidate. The "No Opinion" column indicates the percentage of likely voters who are unfamiliar with the candidate, and the "(R) No Opinion" column shows the percentage of likely Republican voters who are unfamiliar with the candidate.
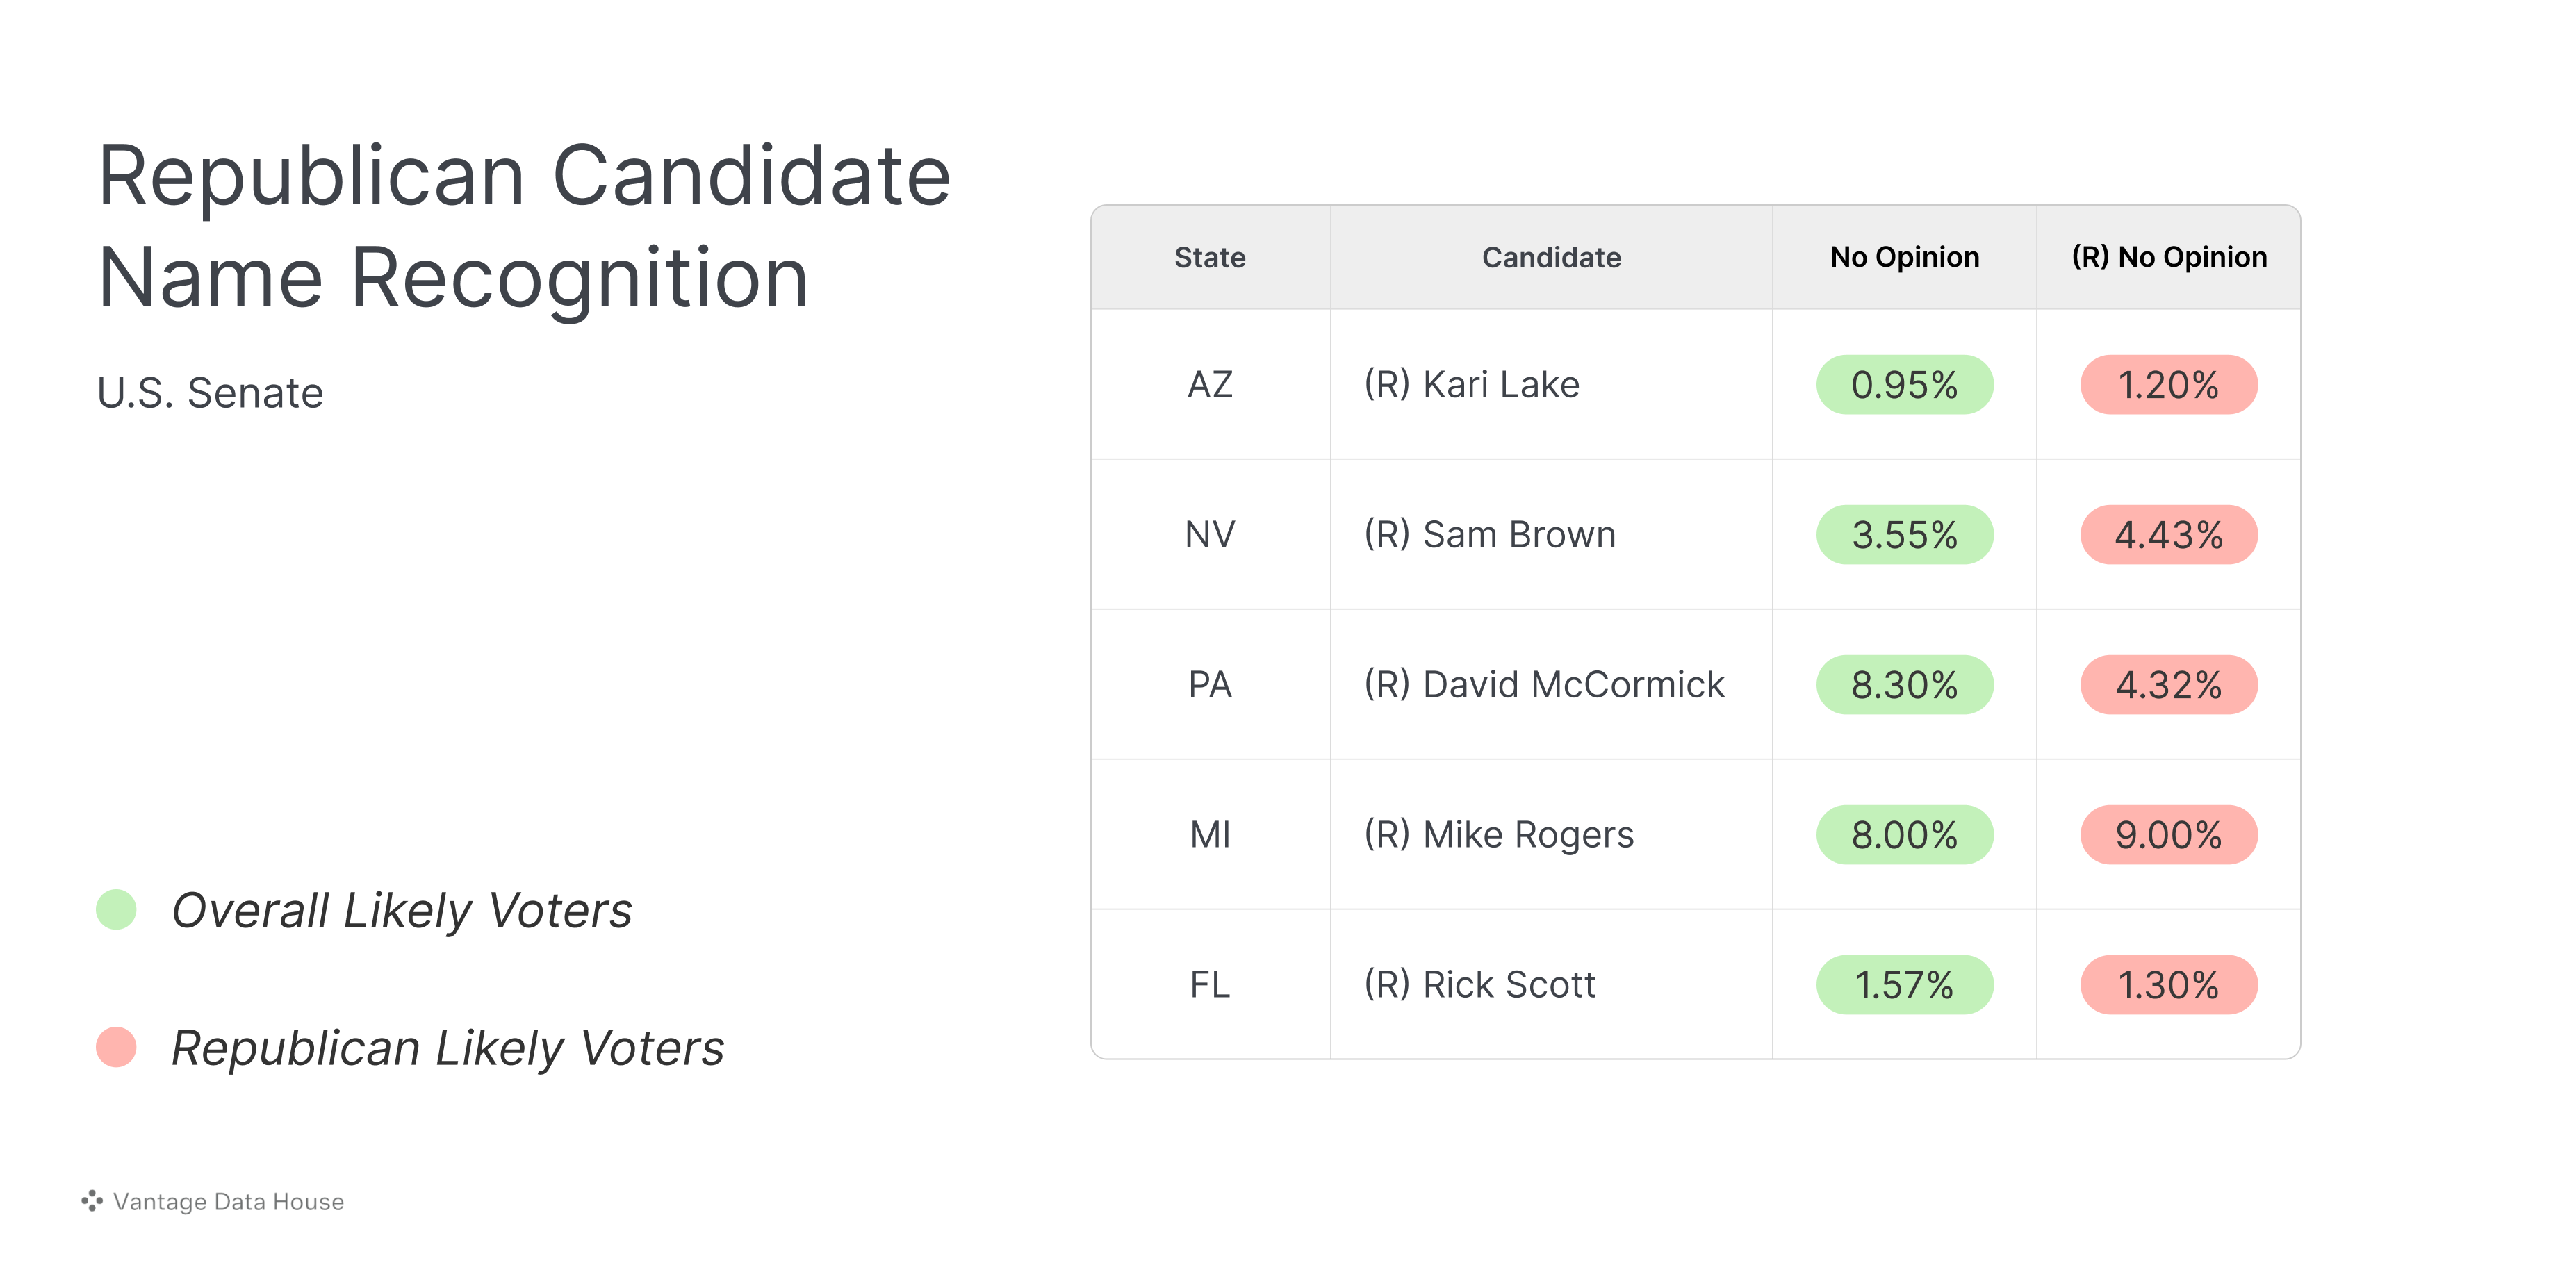
This chart shows that all Republican candidates have significant name recognition among both likely voters and Republican likely voters. In fact, when looking at the candidate's favorability within this subgroup, it becomes clear that these voters are undecided because they hold an unfavorable view of the Republican Senate candidate. However, for the sake of argument, we analyzed our latest 5,000 responses from each swing state to explore what would happen if all undecided Trump supporters in the Senate races shifted their support to the Republican Senate candidate. To do this, we calculated the percentage of undecideds who indicated support for either Trump or Harris in our survey and applied those percentages to the Senate vote shares from 538, RCP, and Vantage to evaluate the impact. If undecided Trump supporters were responsible for the decoupling between presidential and Senate race results, we would expect to see a complete shift in the margins.
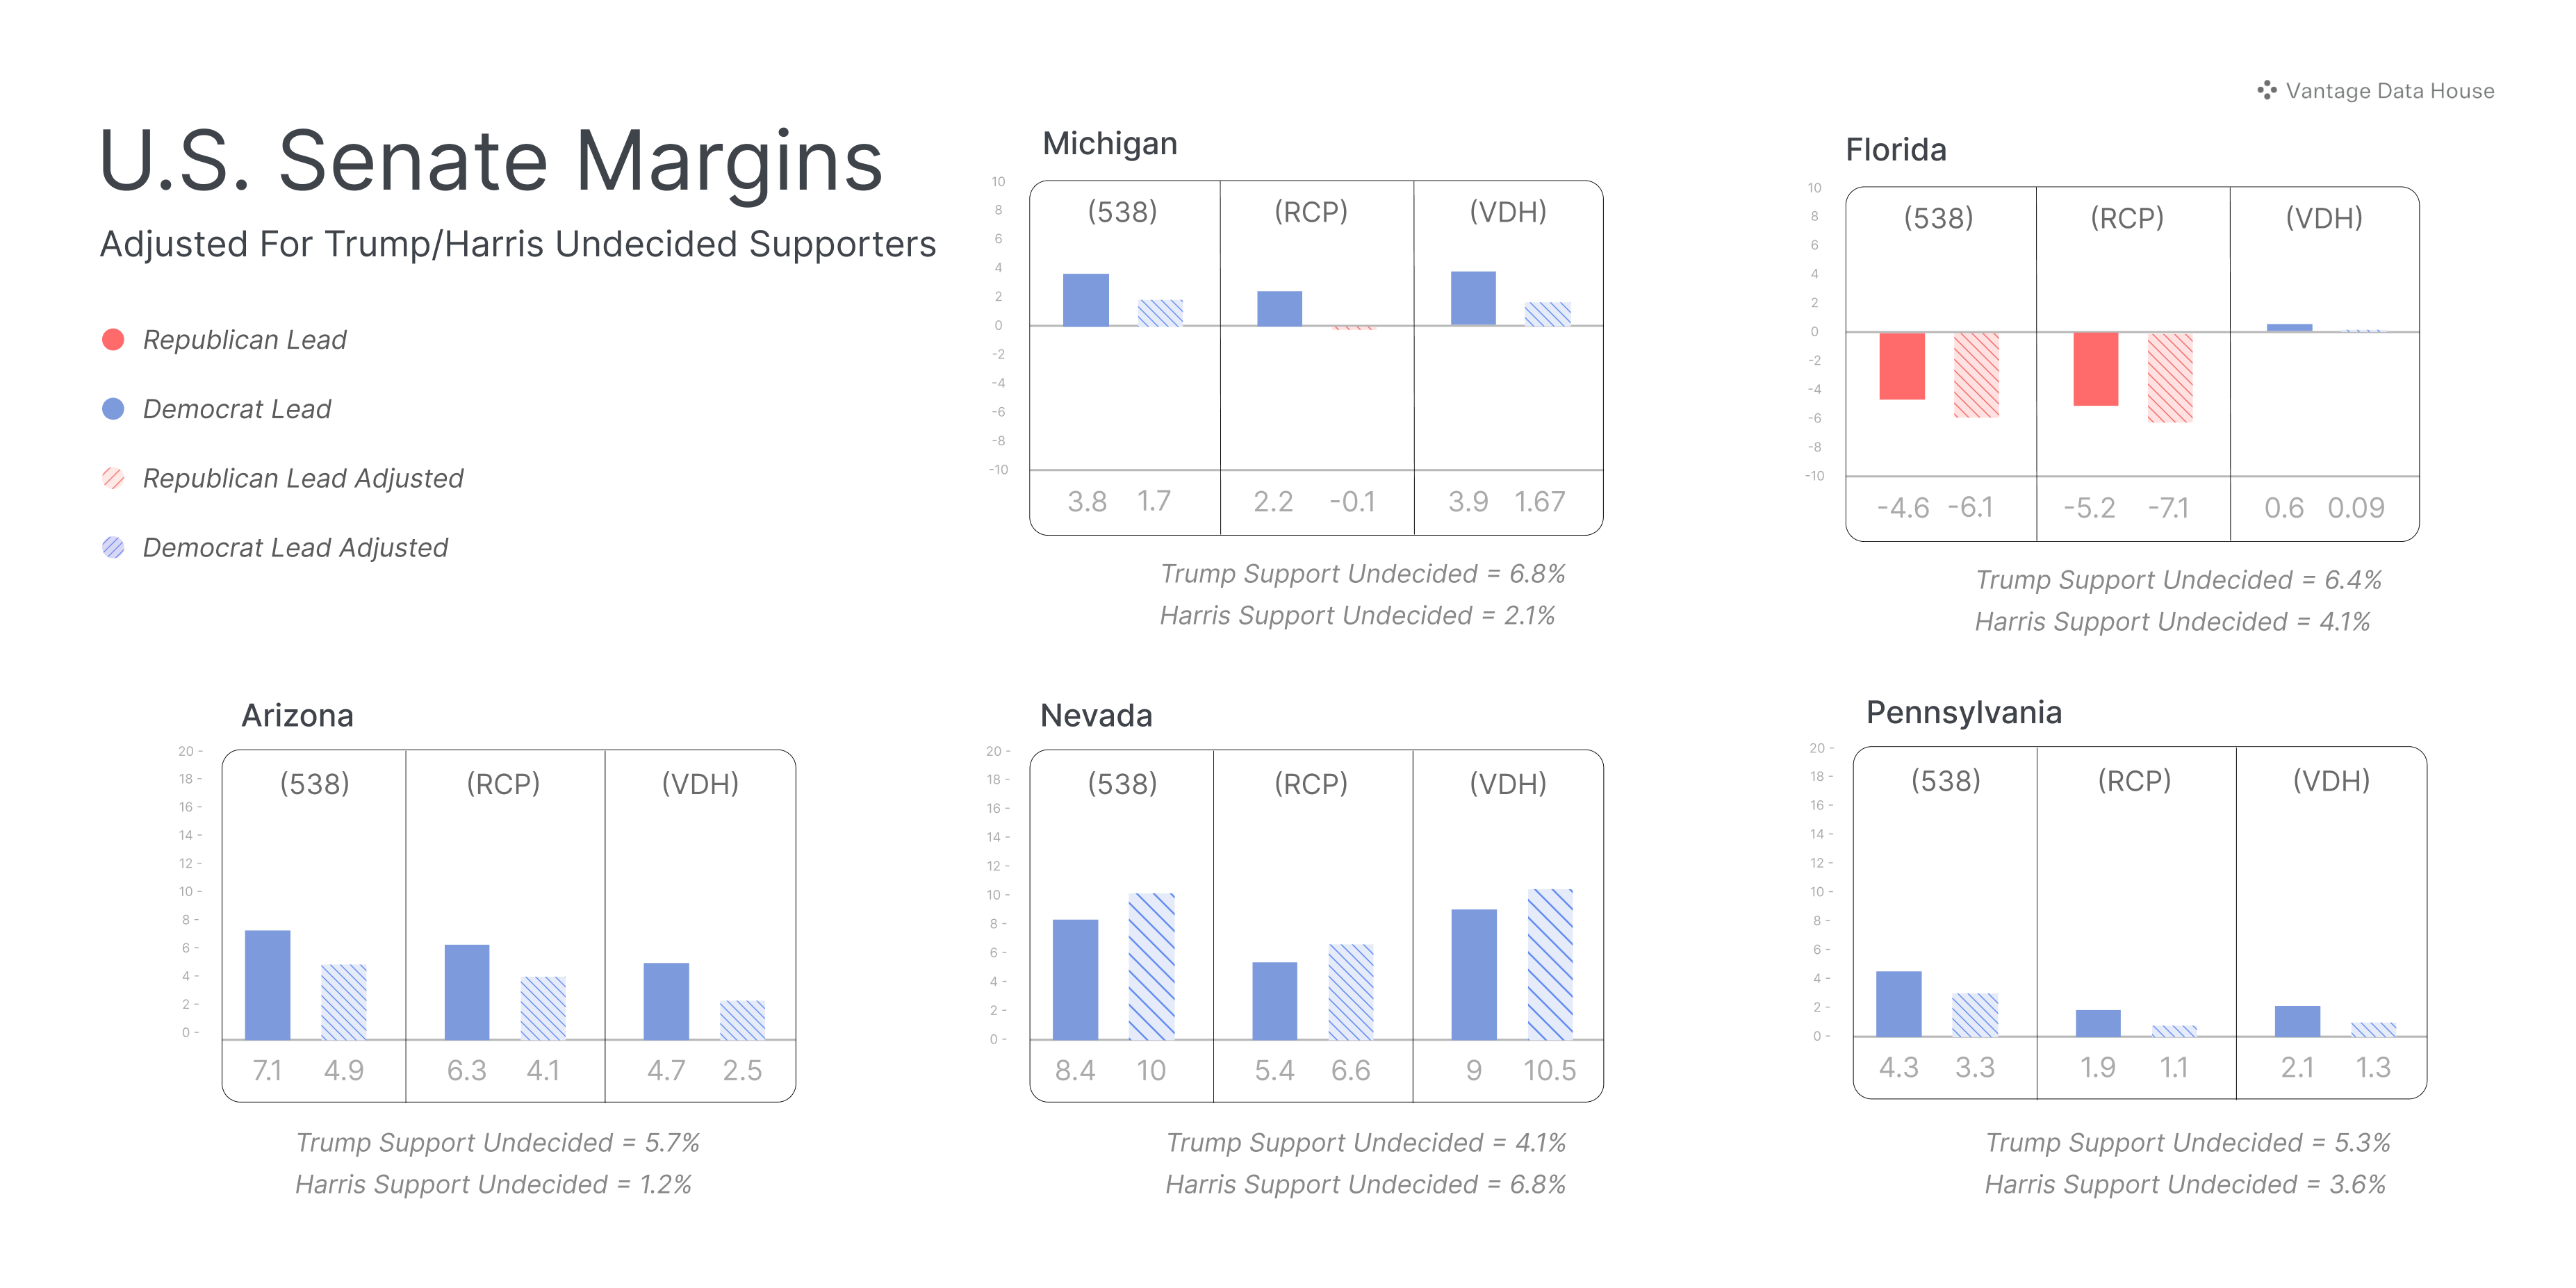
The chart above shows that this adjustment had a minimal impact in the overall numbers. The net average between 538, RCP, and Vantage was -1.01, indicating only a slight change toward Republicans.
This leaves us with on final explanation: the averages are pure noise.
What's Fueling the Noise?
A recent article in the National Journal quoted Democratic consultant Simon Rosenberg who predicted that conservative polling groups would flood the media with polling showing a close race. He was right. In 2022, we saw a similar pattern with the Republican “Red Wave,” where skewed polls inflated the averages. Now, Democratic polling groups may be playing the same game, keeping their internal polls with bullish numbers under wraps to keep the race appearing as close as possible and their voters engaged.
Averages like those from 538 and RCP try to counter these biases by minimizing outliers and accounting for partisan effects. However, the problem is that every publicly released poll is biased. No one is releasing a $25,000–$80,000 poll out of the goodness of their heart. When a campaign releases a poll, it’s not to inform the public; it’s to shape public perception in favor of their candidate or agenda. No campaign is going to openly tell a reporter, "We’re in big trouble." They know media outlets love polls because they lend credibility, allowing the media to say, "We’ve got the real story." This creates an interdependent relationship between campaigns, pollsters, and the media.
Independent polling groups are not immune either. Many prefer to be wrong with the crowd rather than risk standing as outliers, so they adjust their numbers and reinforce the faulty averages.
So, what’s being missed in all the noise? A significant widening of the gender gap and Harris’ growing support among independents, which is propelling her toward a potential 300+ electoral college victory.
Mind the Gap
Women are showing unprecedented enthusiasm in this election, driven by issues like abortion and the potential to elect the first female president. In 2016, the gender gap—measuring the difference between male and female voting patterns—was one of the largest in U.S. history (24 points). Many believed it was an anomaly, but the trend has persisted, and it shows no signs of slowing down for 2024. In fact, it might be one of the widest gender gaps ever recorded.
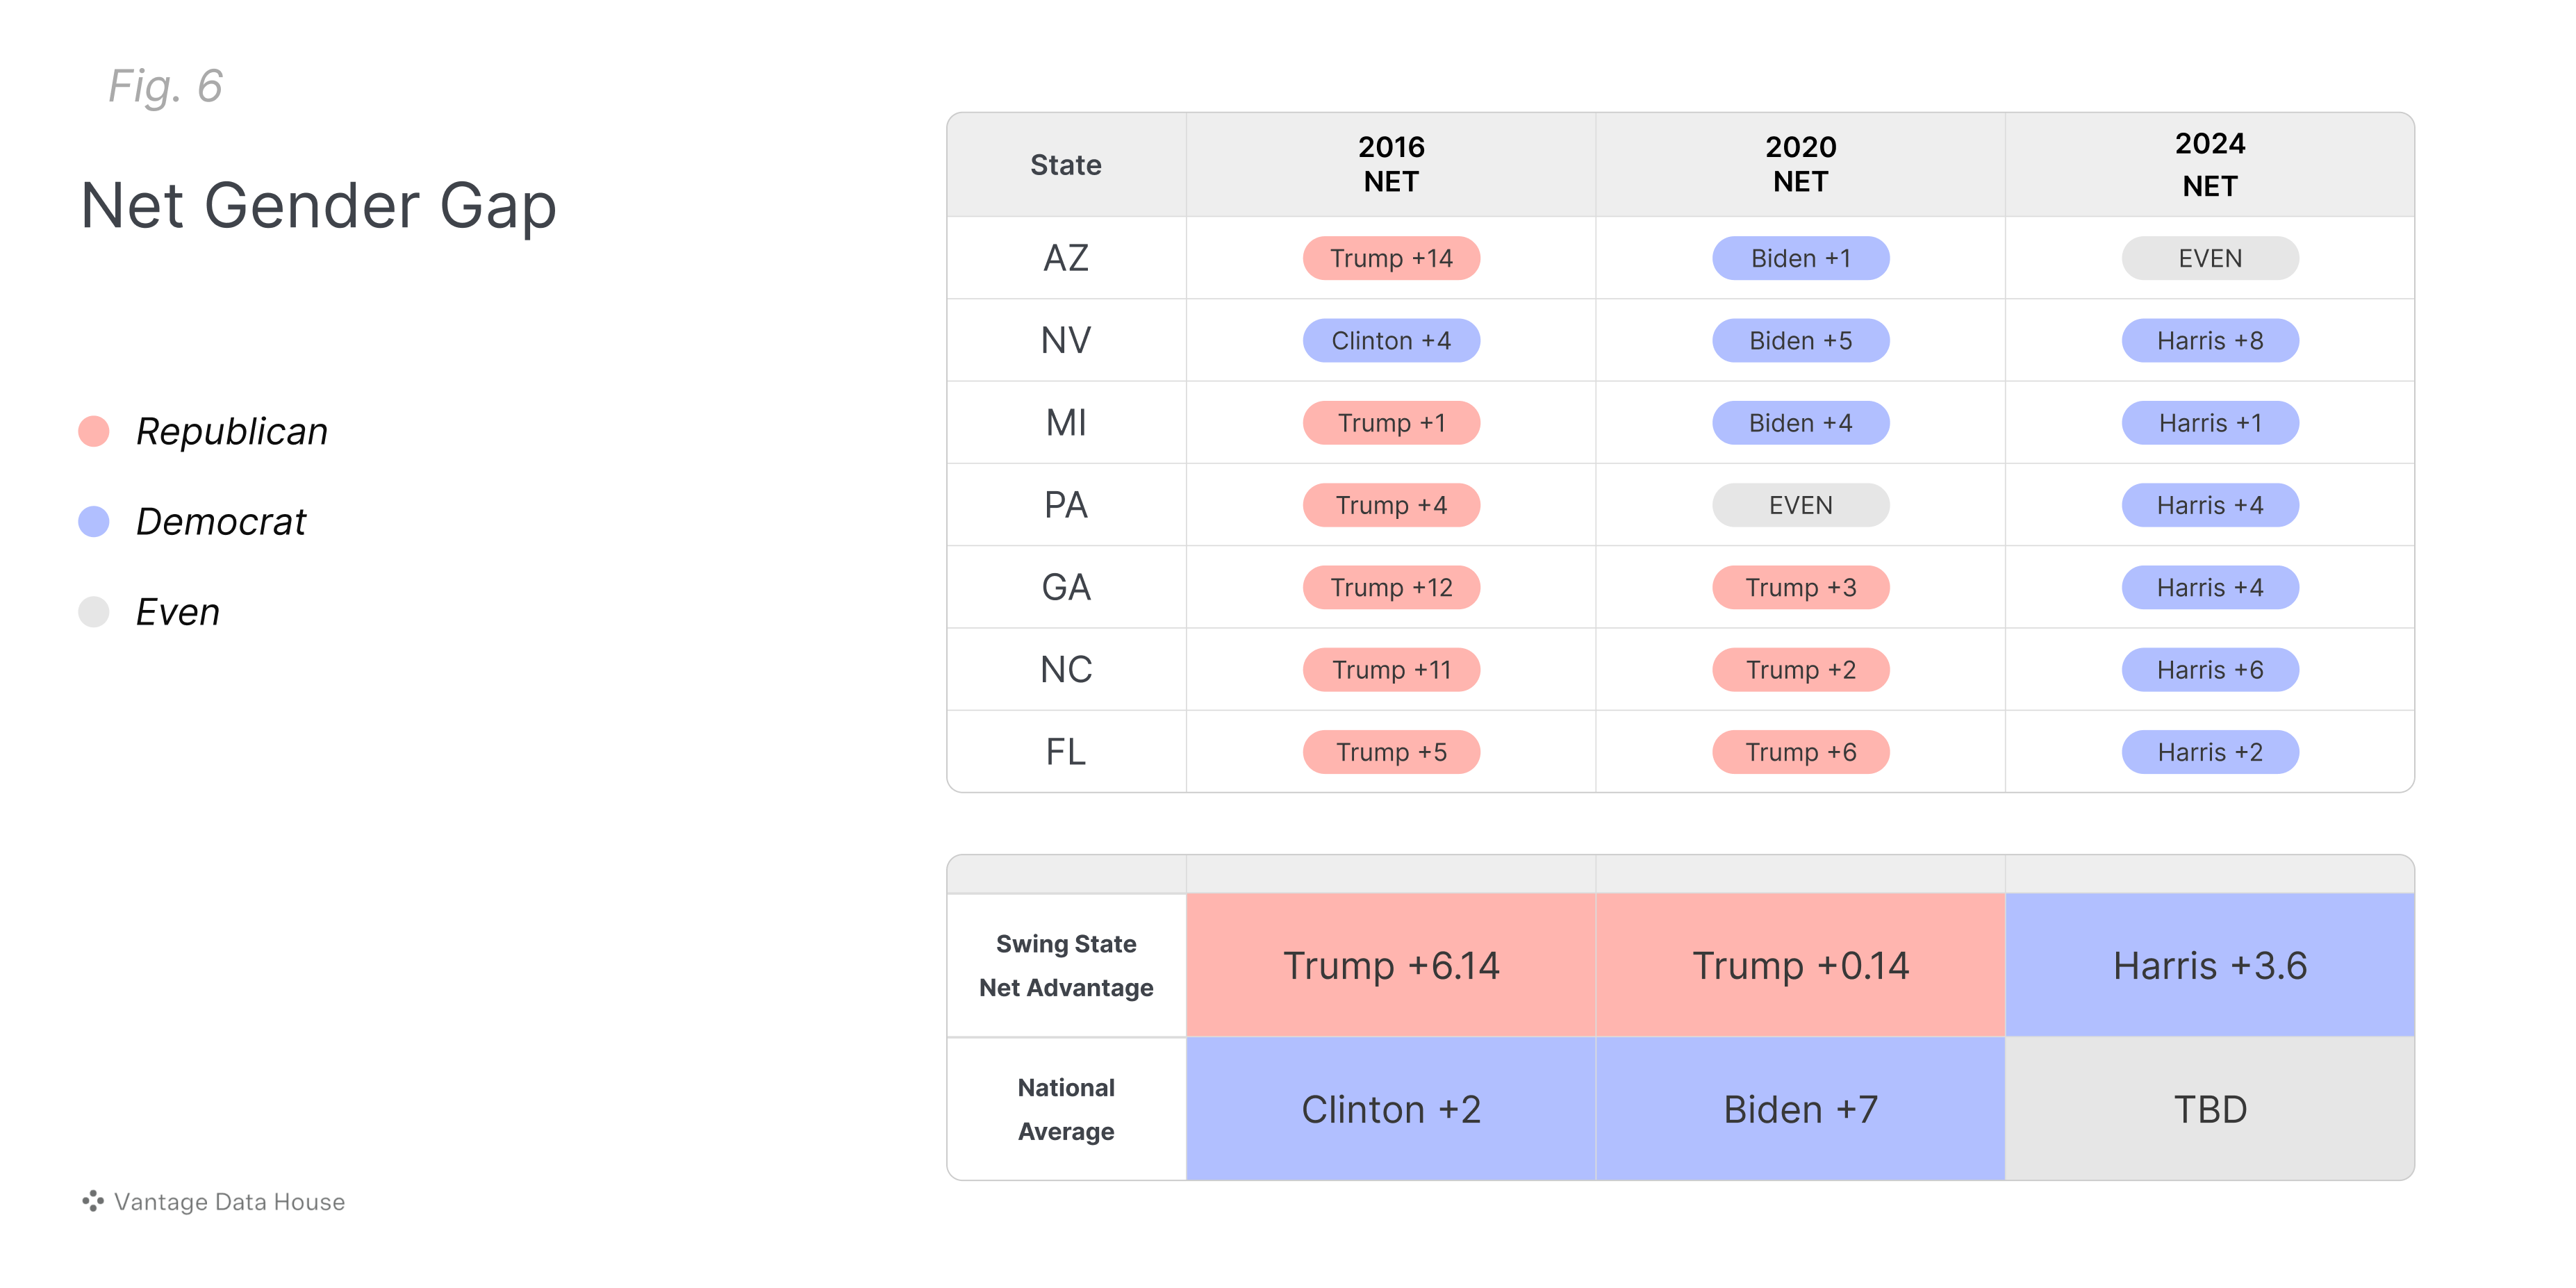
Understanding the gender gap shows how voting patterns differ between men and women, but it doesn’t tell you which candidate benefits from it. To figure this out, we use the net gender gap (figure 6), which is the difference between the lead among women and the lead among men. For example, in Michigan, if Harris leads women by 8 points and Trump leads men by 7 points, Harris has a net gender gap of +1.
In 2016, Trump had an average +6 net advantage in the swing states, helping him win all but Nevada. By 2020, this margin had shrunk to just +0.14 average. Now, in 2024, the story has shifted dramatically—Harris heads into Election Day with an average +3.6 net advantage, holding a substantial lead in all swing states, except Arizona.
This shift presents a serious problem for Trump in key states like North Carolina, Georgia, and Florida, where he once held a net advantage in both 2016 and 2020. Now, Trump risks losing two, possibly all three, of these must-win states:
- Georgia: With 56% to 57% of likely voters being women, Harris holds a clear edge.
- Florida: The abortion referendum is expected to drive record-high female turnout, which doesn’t put the state out of the question.
- North Carolina: Trump's challenges with women are being amplified by the chaos surrounding the gubernatorial race, further tipping the scales in Harris’ favor.
Both campaigns are well aware of the gender gap issue and have recently attempted to address it. The Trump campaign held an all-women audience at a Fox News town hall, while the Harris campaign enlisted former President Obama to help engage African American men.
While both campaigns scramble to address the gender gap, they may be missing an even greater shift: independents in key swing states are now breaking heavily for Harris.
The Independent Signal
In 2016, Trump held a commanding lead among independent voters in swing states, winning these voters by an average margin of 8.5 points. However, by 2020, this advantage had completely flipped to Biden, who won independent voters in swing states by an average of 7.5 points. This trend seems to have continued into 2024, as we’re seeing a dramatic surge in support for Harris from independent voters. Since the end of September, her lead among independents has jumped from an average of 5.6 points to an impressive 15.7 point average. This shift represents a clear signal in the data—independents are now breaking decisively for Harris, and they’re breaking hard, cutting through the usual noise that can cloud polling averages.
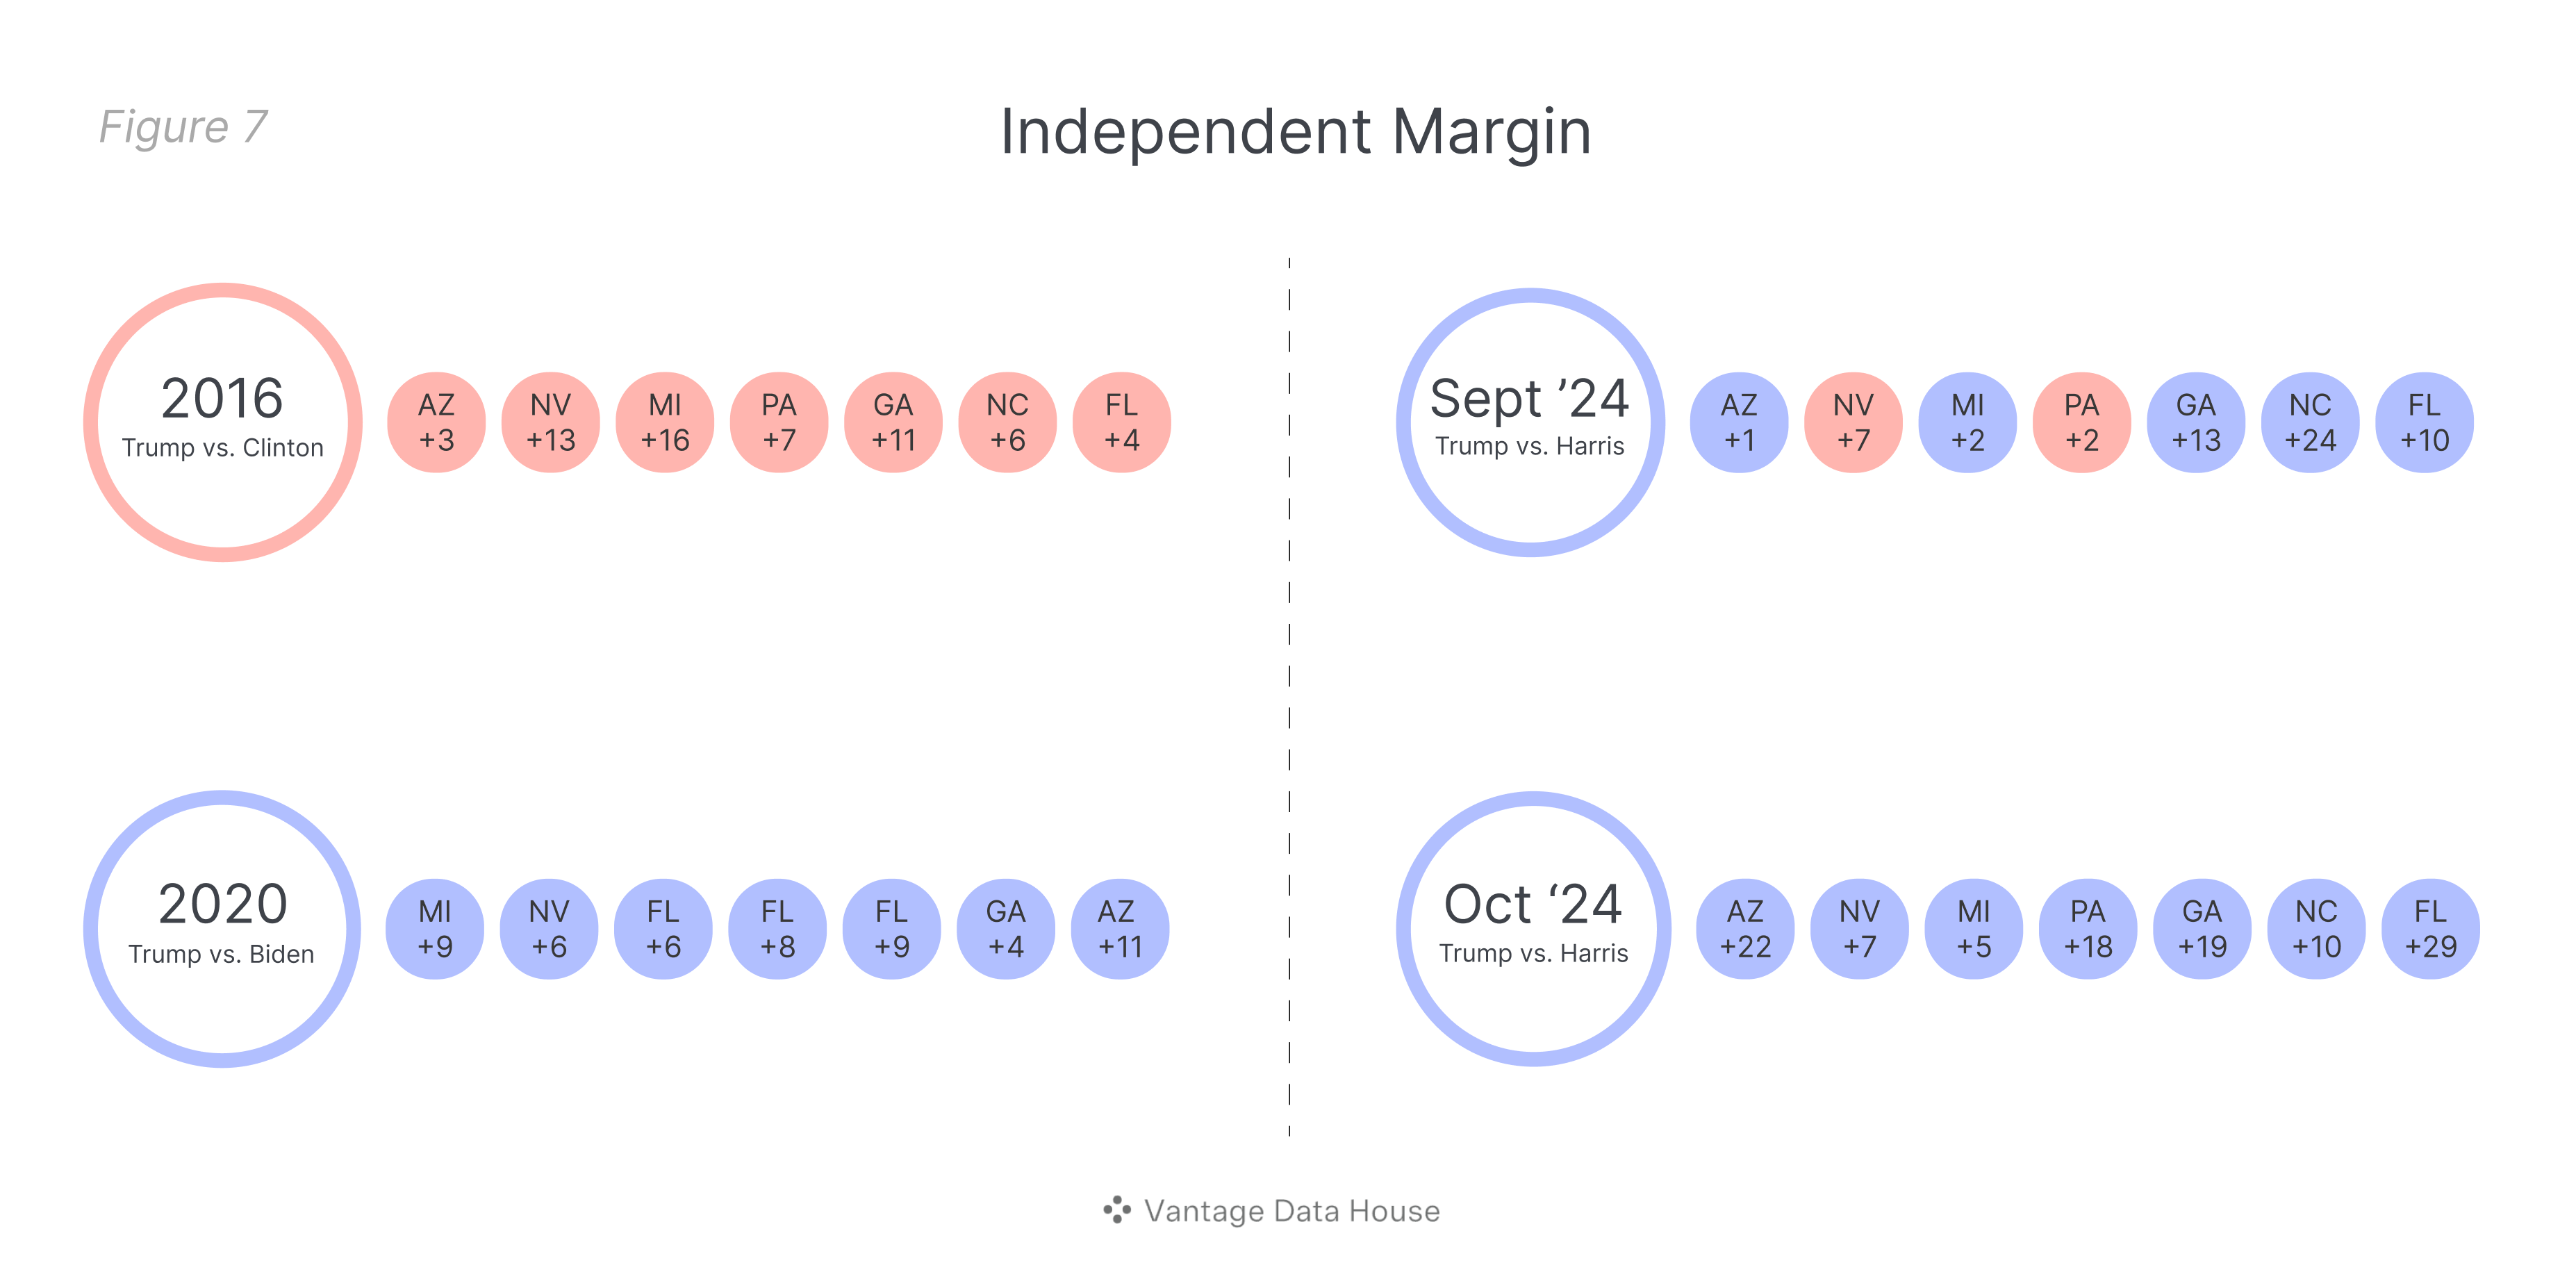
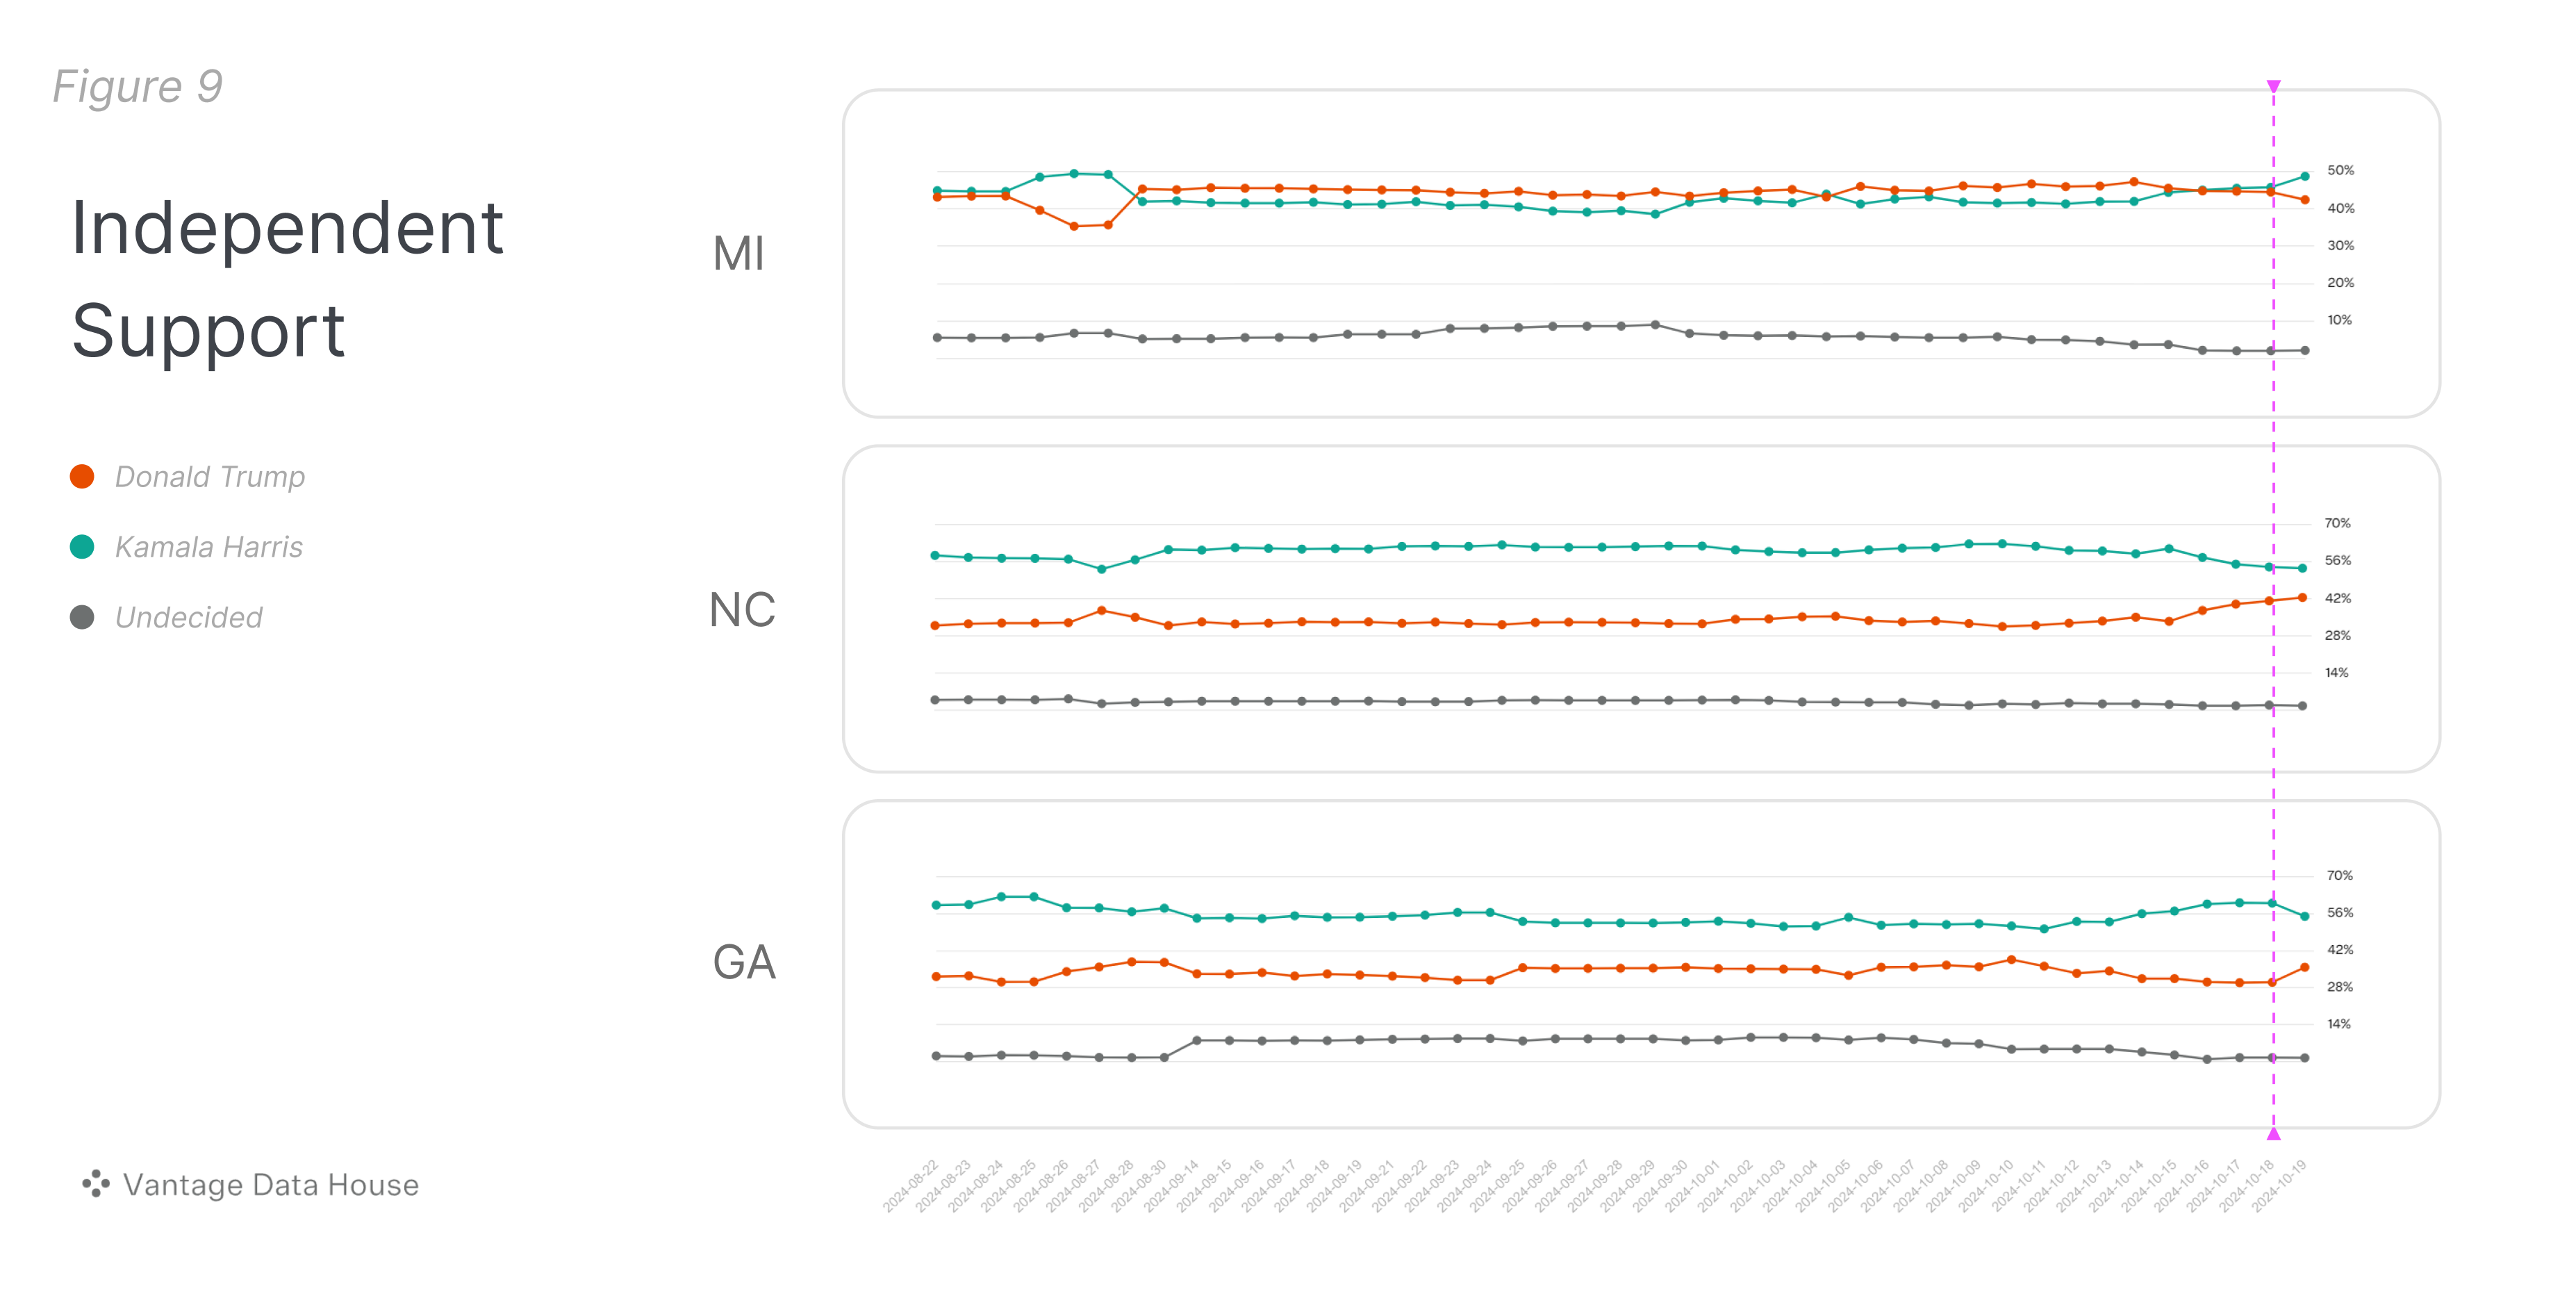
States like Arizona, Nevada, Pennsylvania, and Florida have seen the most dramatic shifts in independent voter support since the beginning of October. In Arizona and Nevada, the trend lines show a consistent surge toward Harris, as independents move away from Trump. Pennsylvania, however, is showing signs of leveling off after a strong initial shift toward Harris.
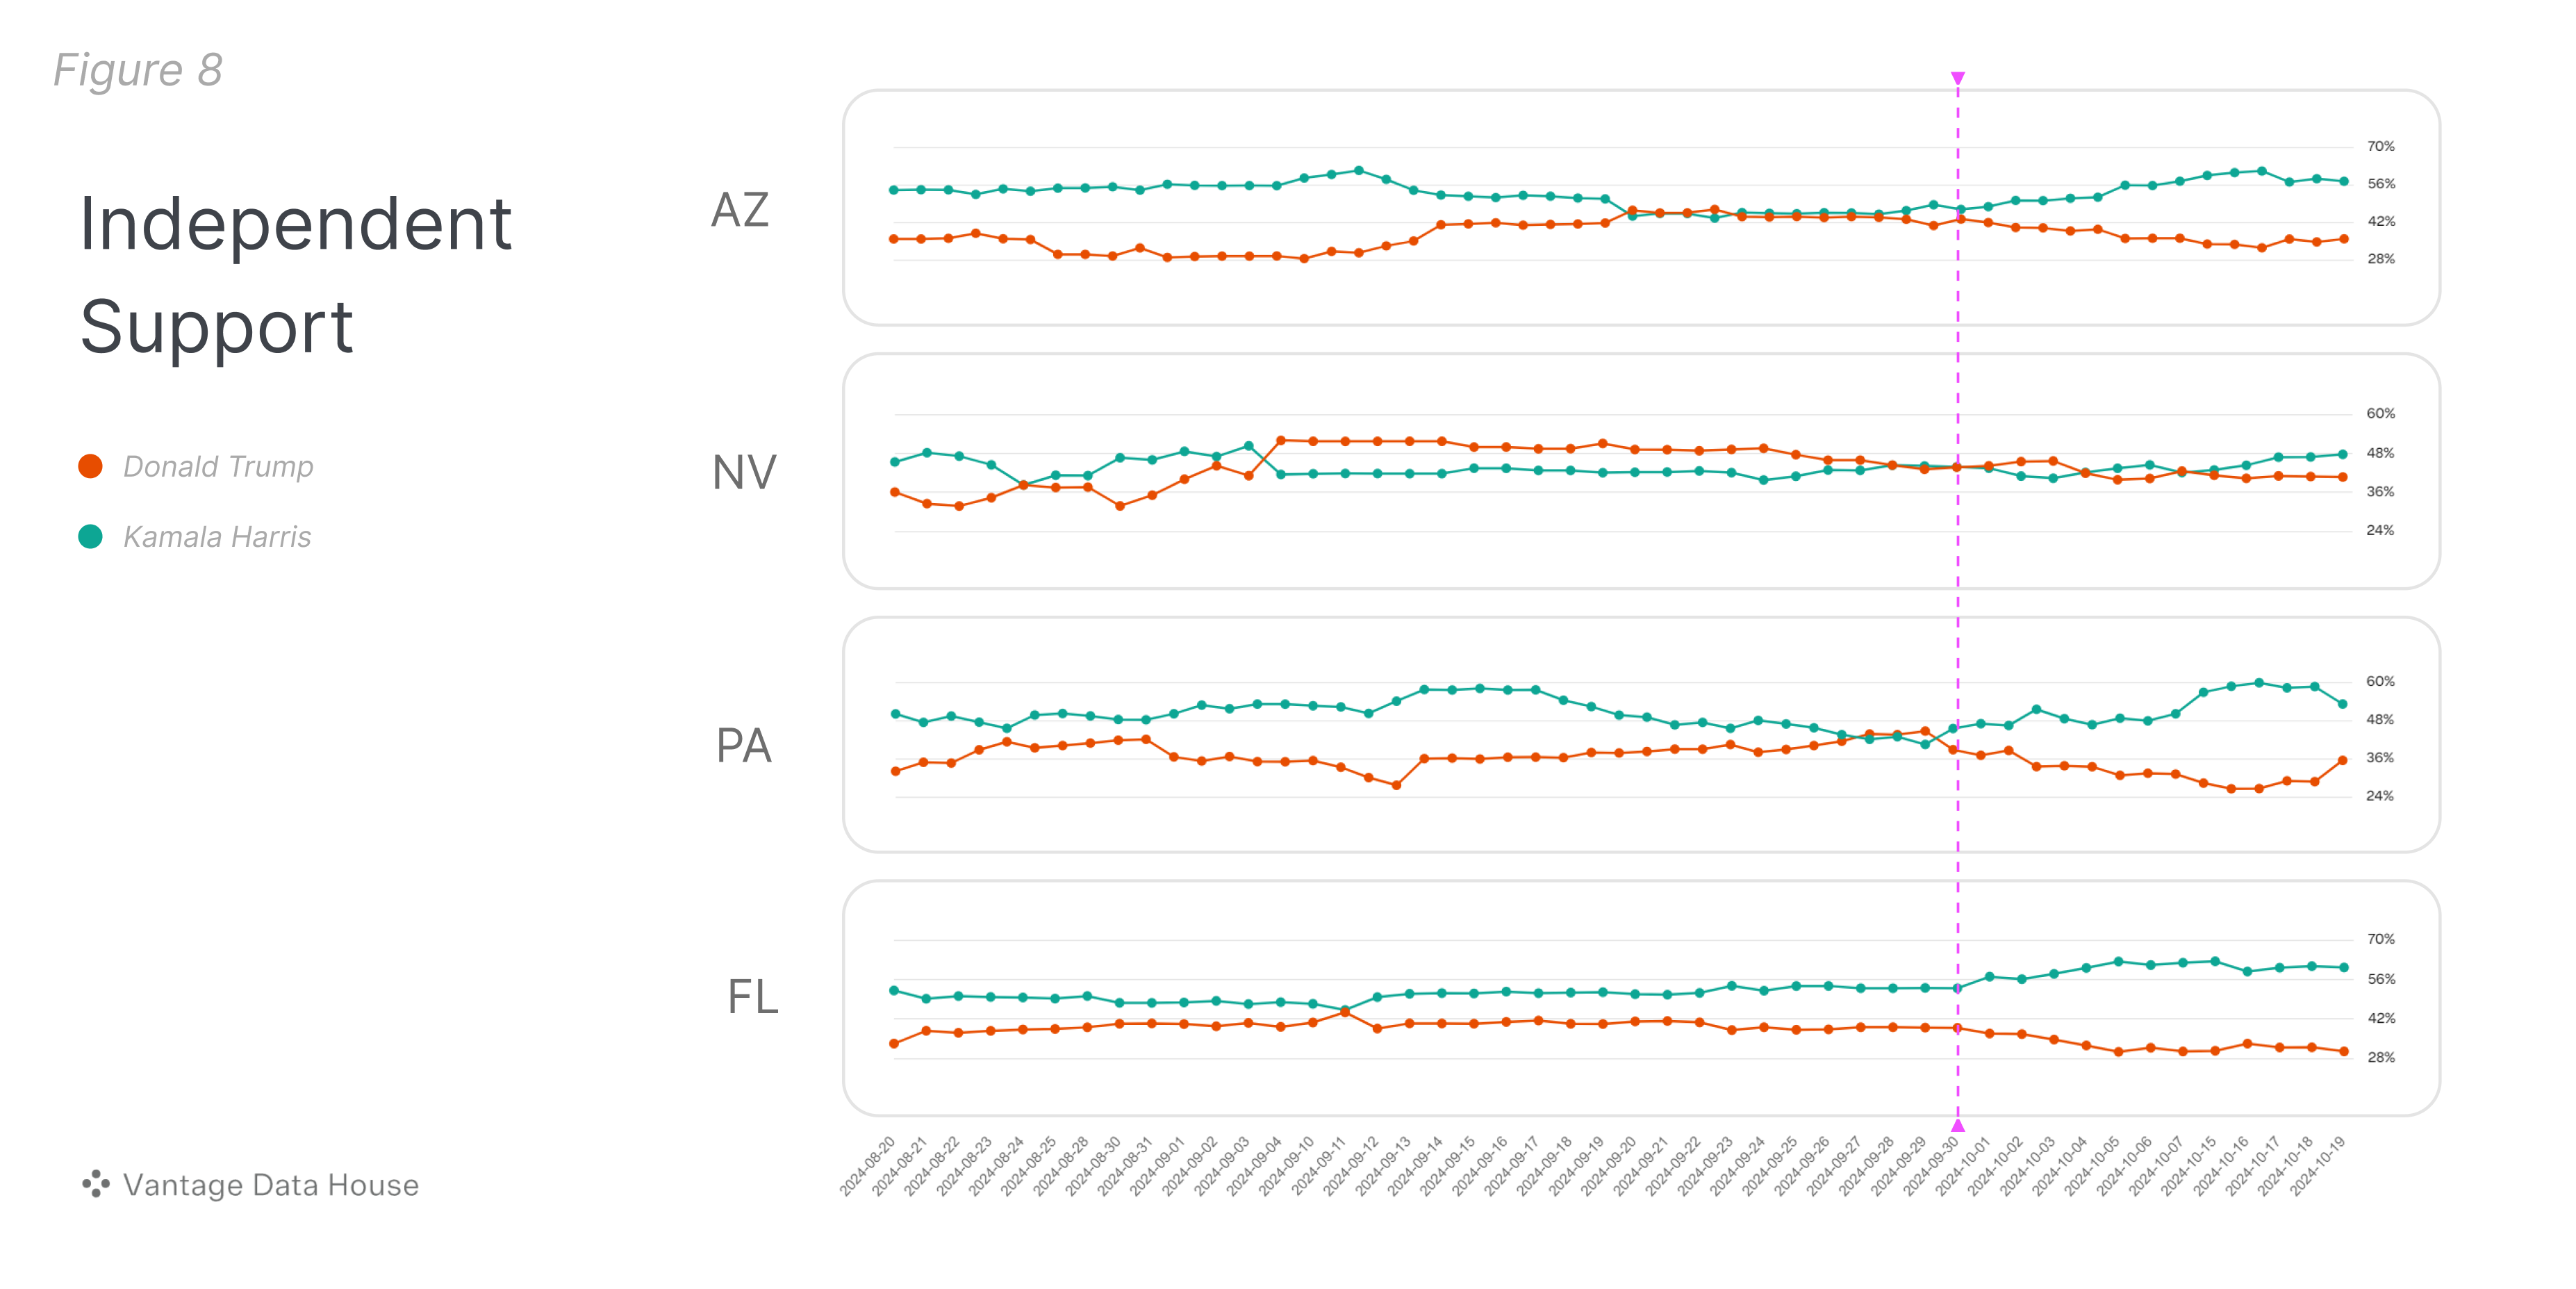
Harris has gained notable independent support in Georgia this week, even though the shift seems marginal compared to other states. In Michigan, the trend lines for independents are essentially dead even. Meanwhile, North Carolina stands out as the only state where Harris’ support among independents shows the gap closing.
Florida’s Shifting Ground
Can Harris take Florida? Possibly, but we don’t expect Trump to lose. He’s been polling ahead by +2 to +4 for a while, and Harris’ recent gains are within the margin of error.
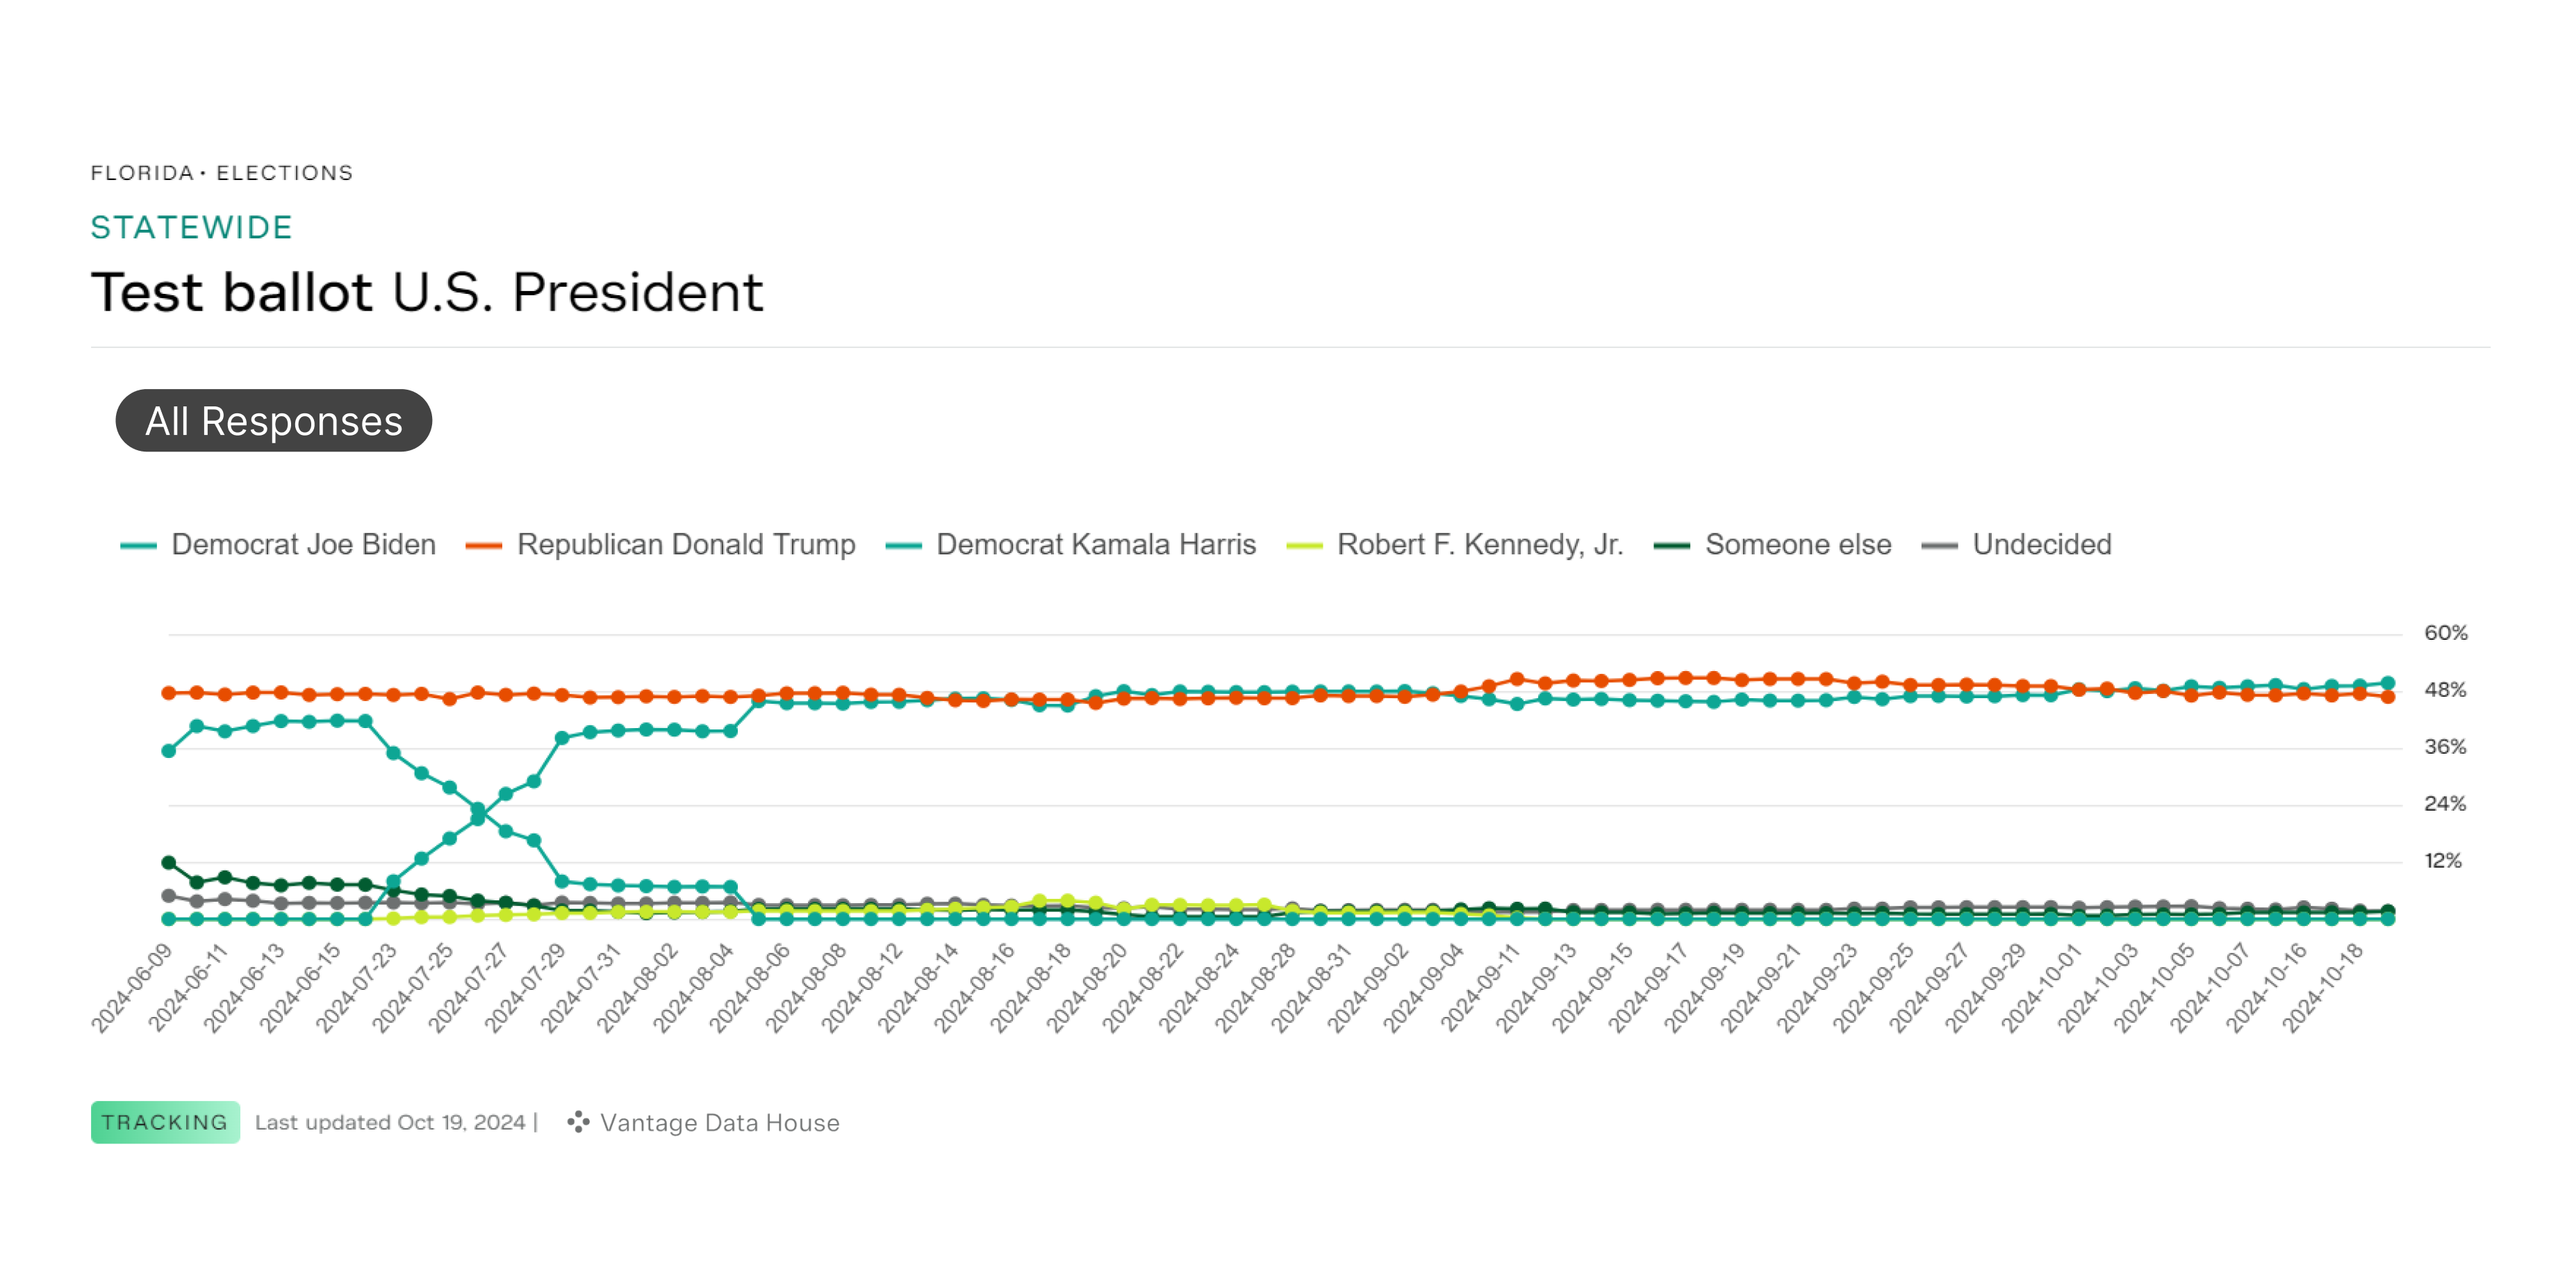
Although Trump’s million-vote advantage from new registrations makes flipping Florida difficult, there are a few key indicators to watch out for.
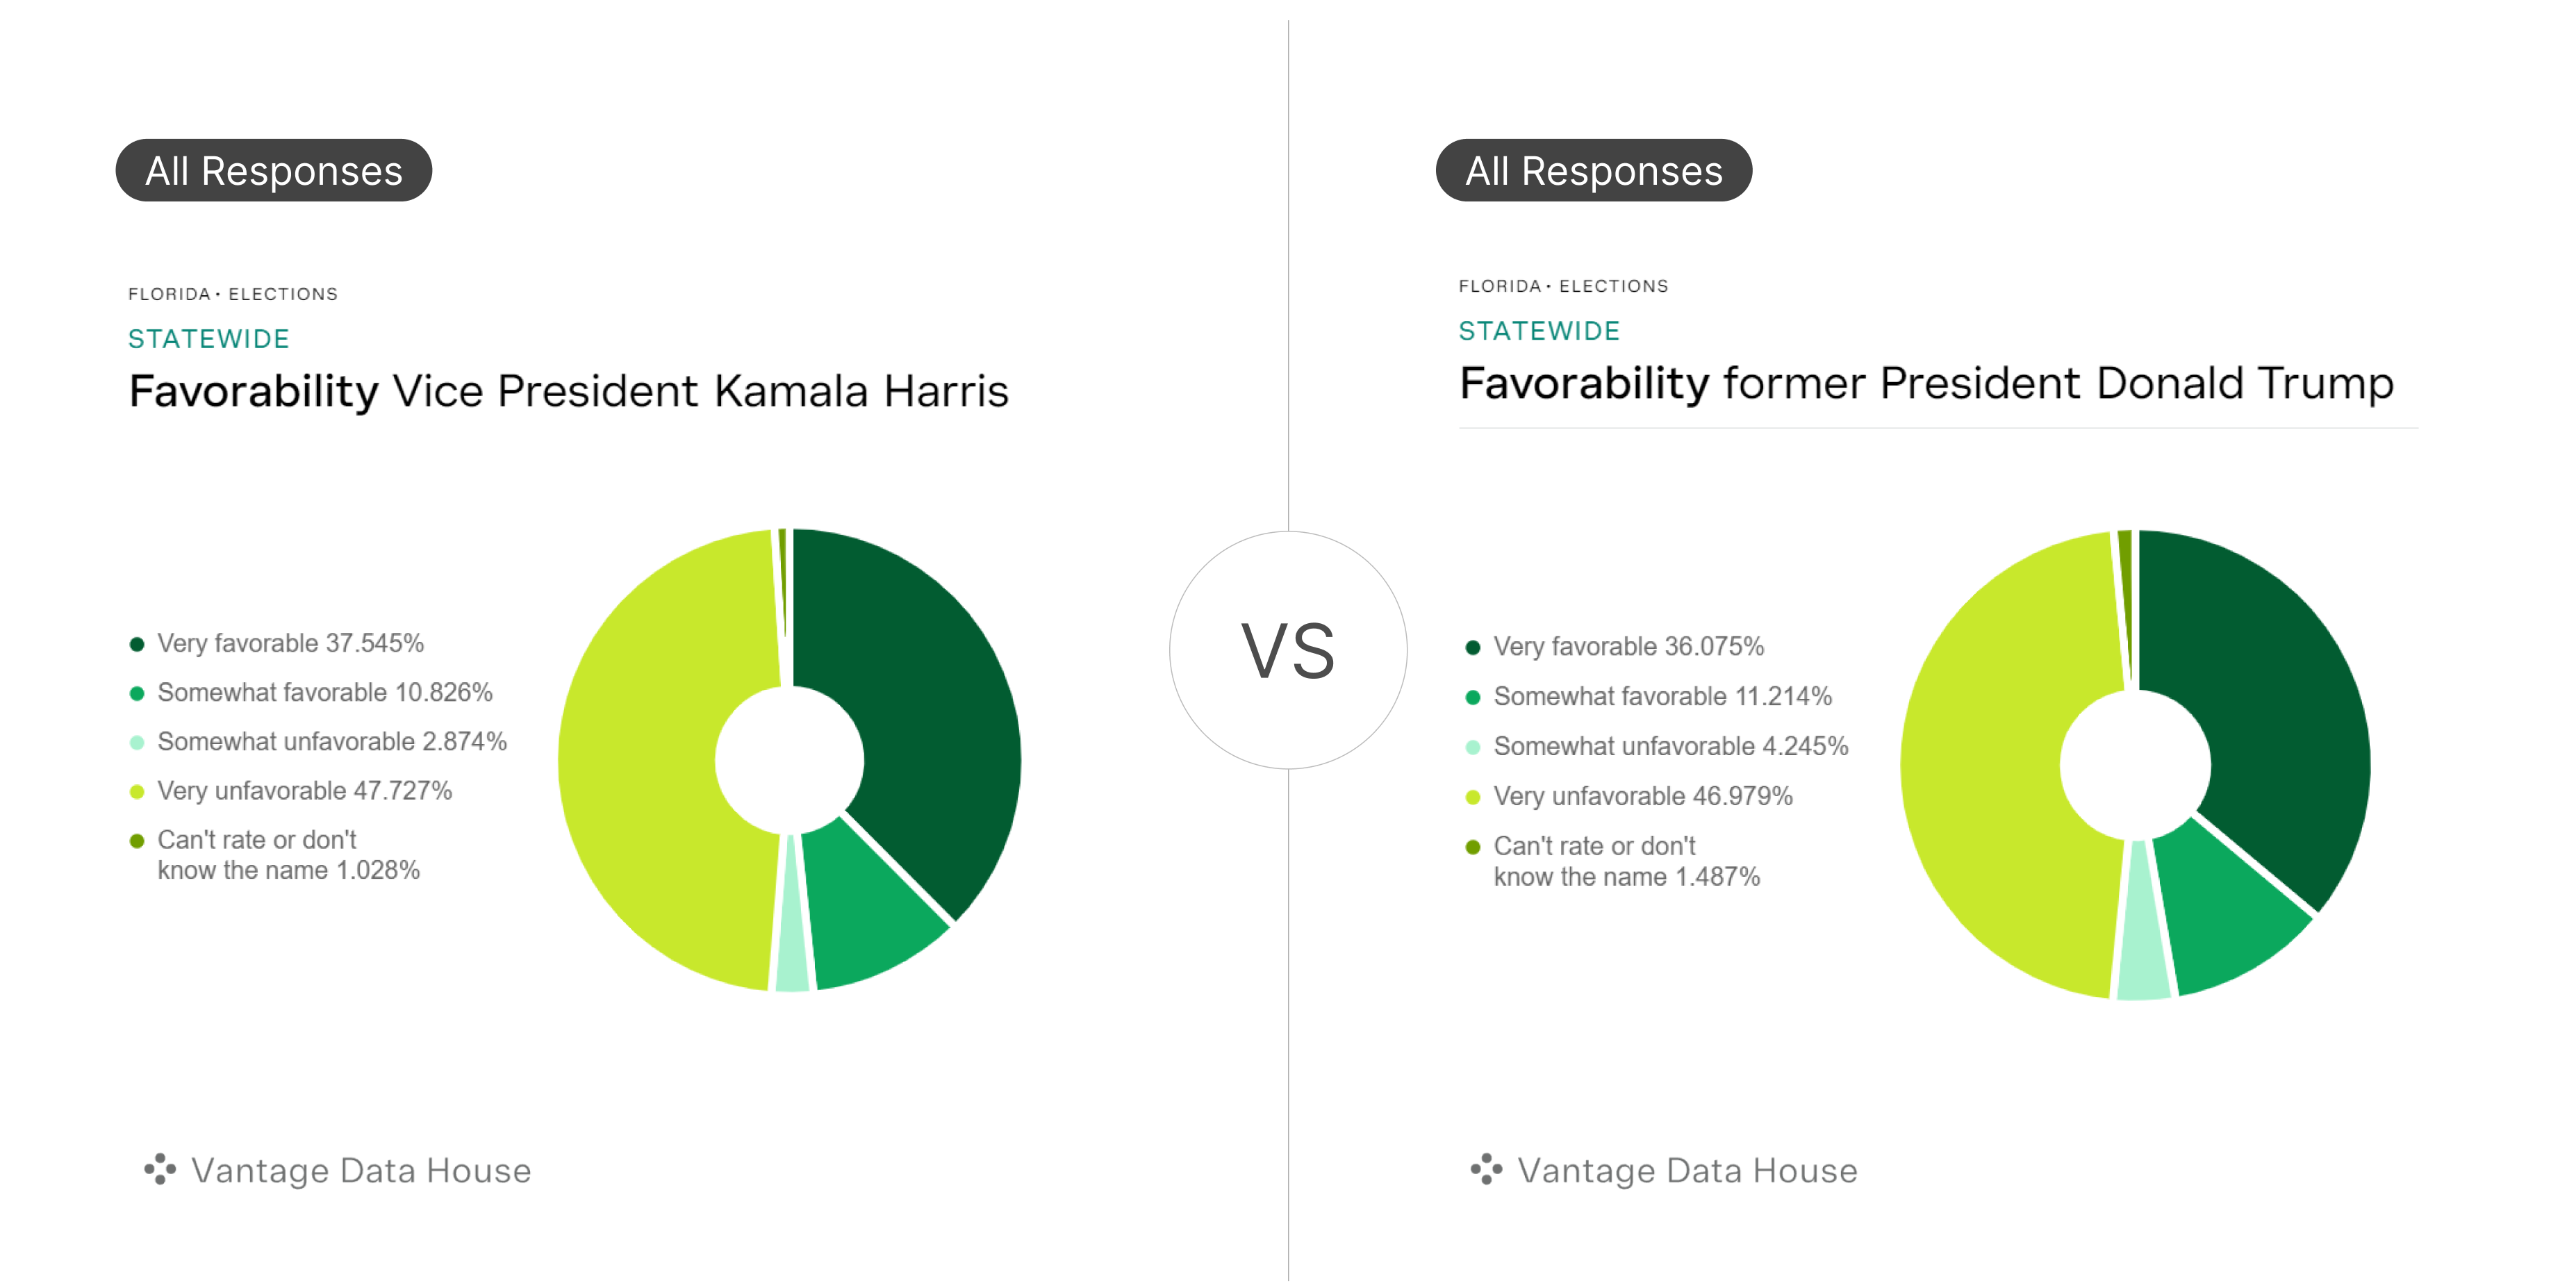
Harris’ Favorability:
Harris’ favorability is slightly better than Trumps, and we’ve never seen a candidate win with worse favorability.
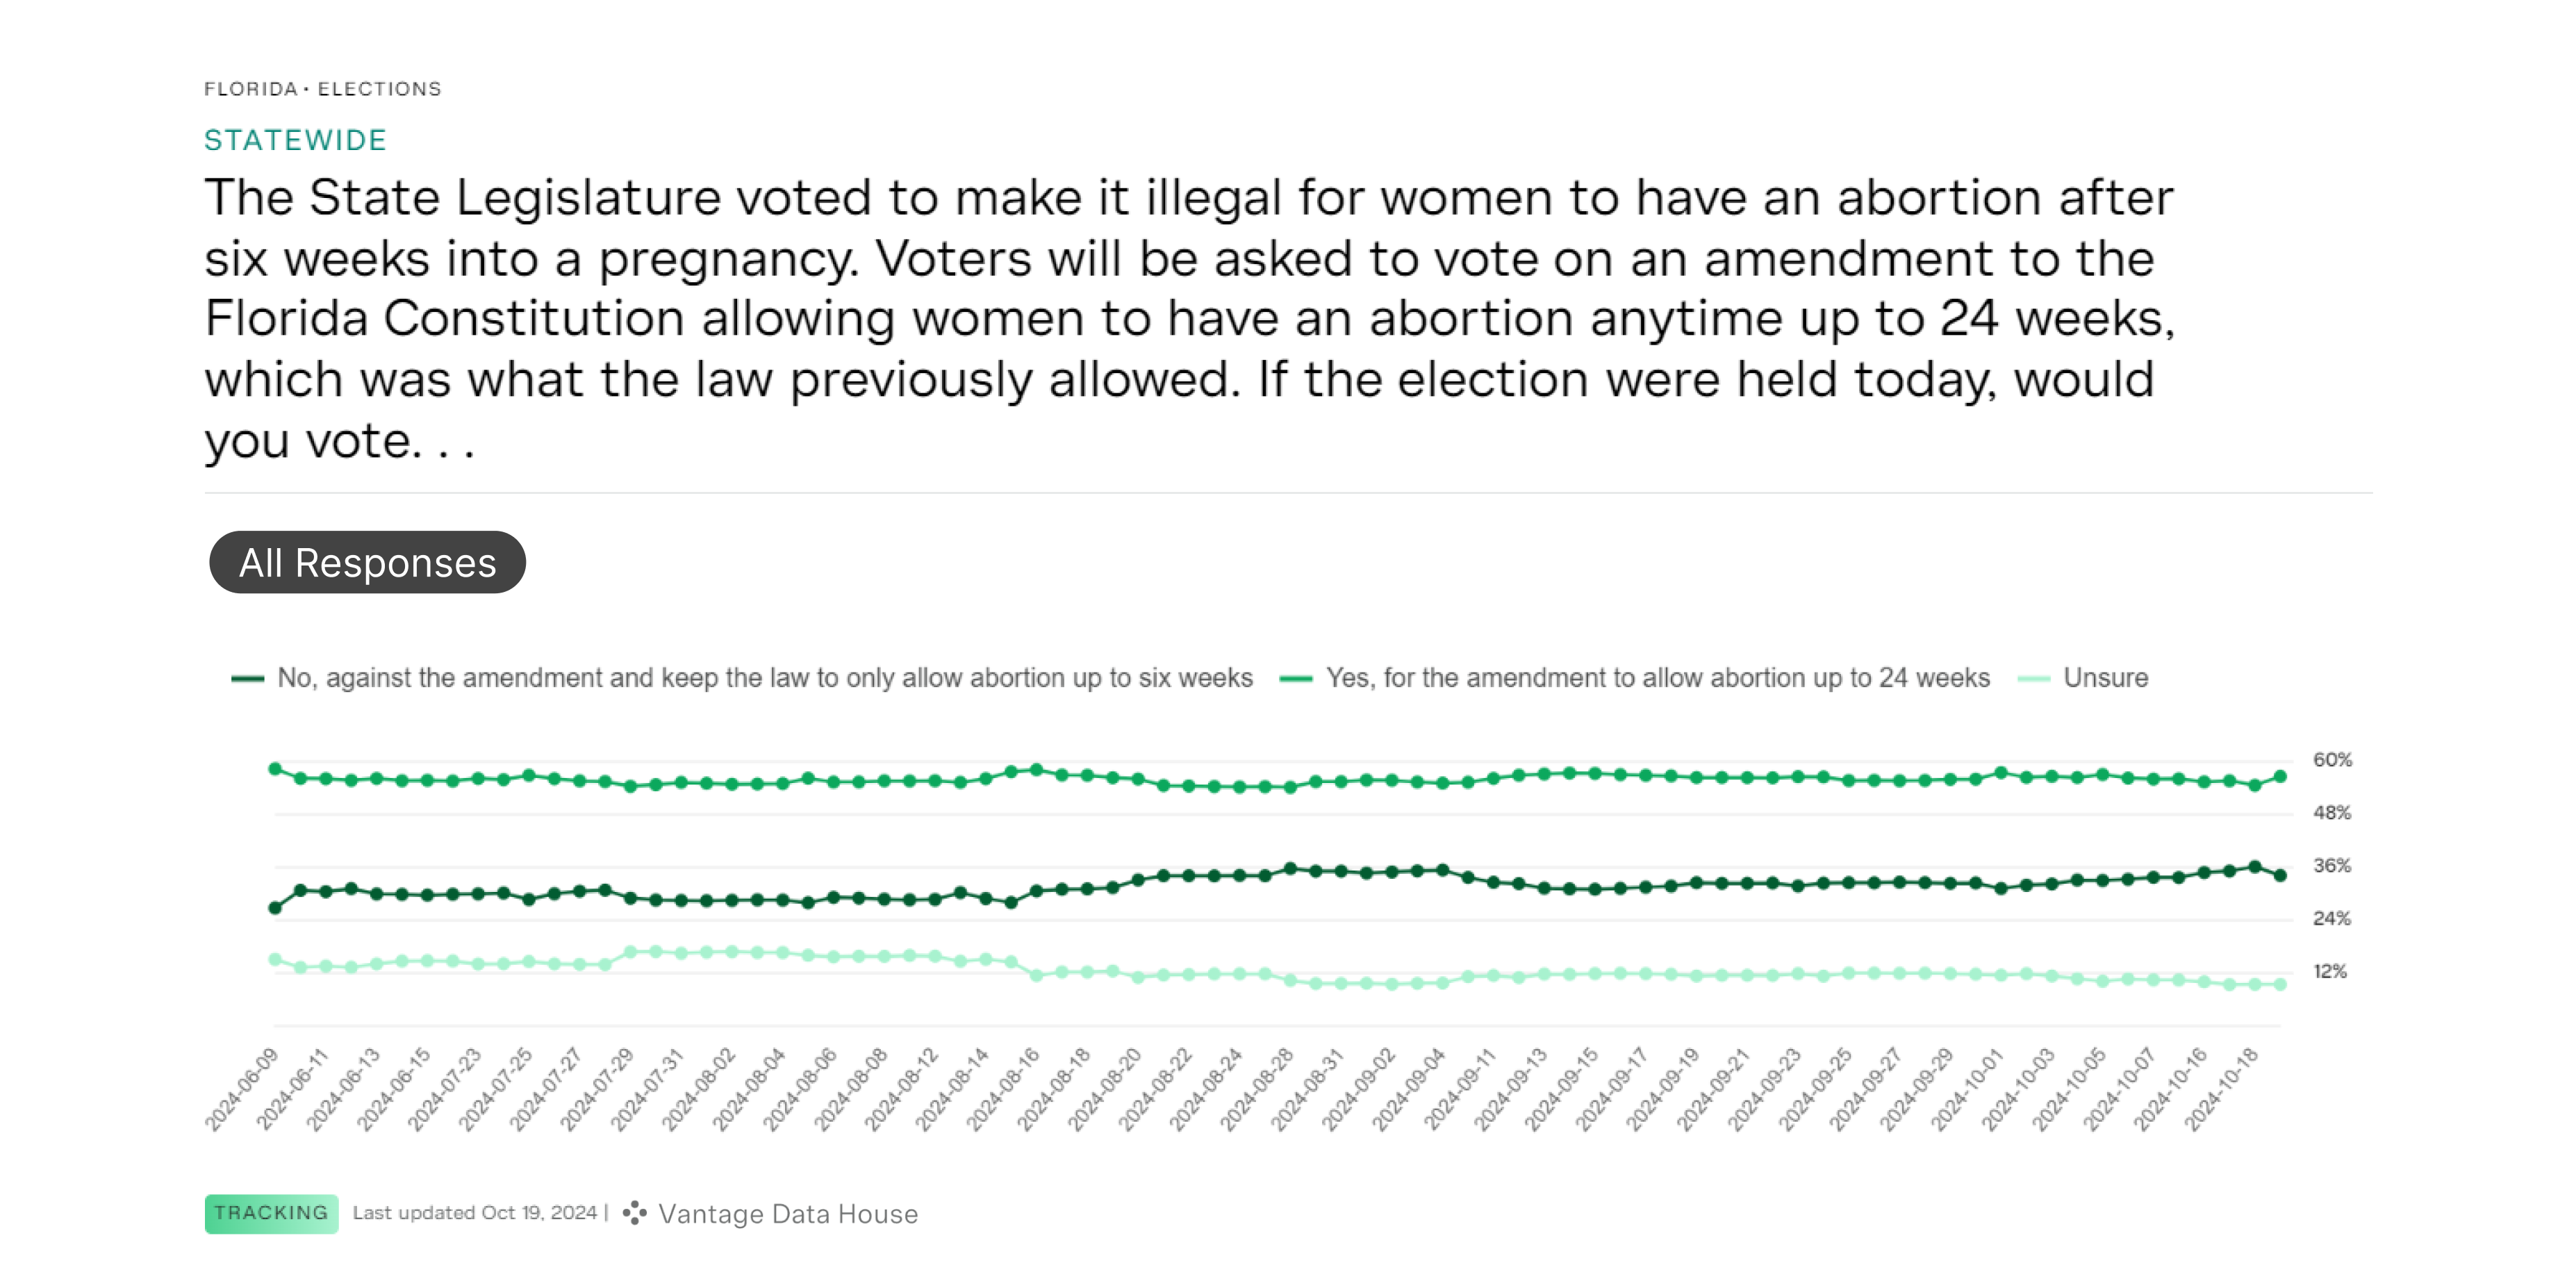
Abortion Amendment:
The abortion referendum is getting close to passing and it’s widening the gender gap. Governor DeSantis is using state resources to oppose it, and we’re already seeing backlash among women in our trendlines. On top of that you have advocacy groups spending millions to get women out to vote for the amendment. We could see one of the highest female turnouts in Florida history.
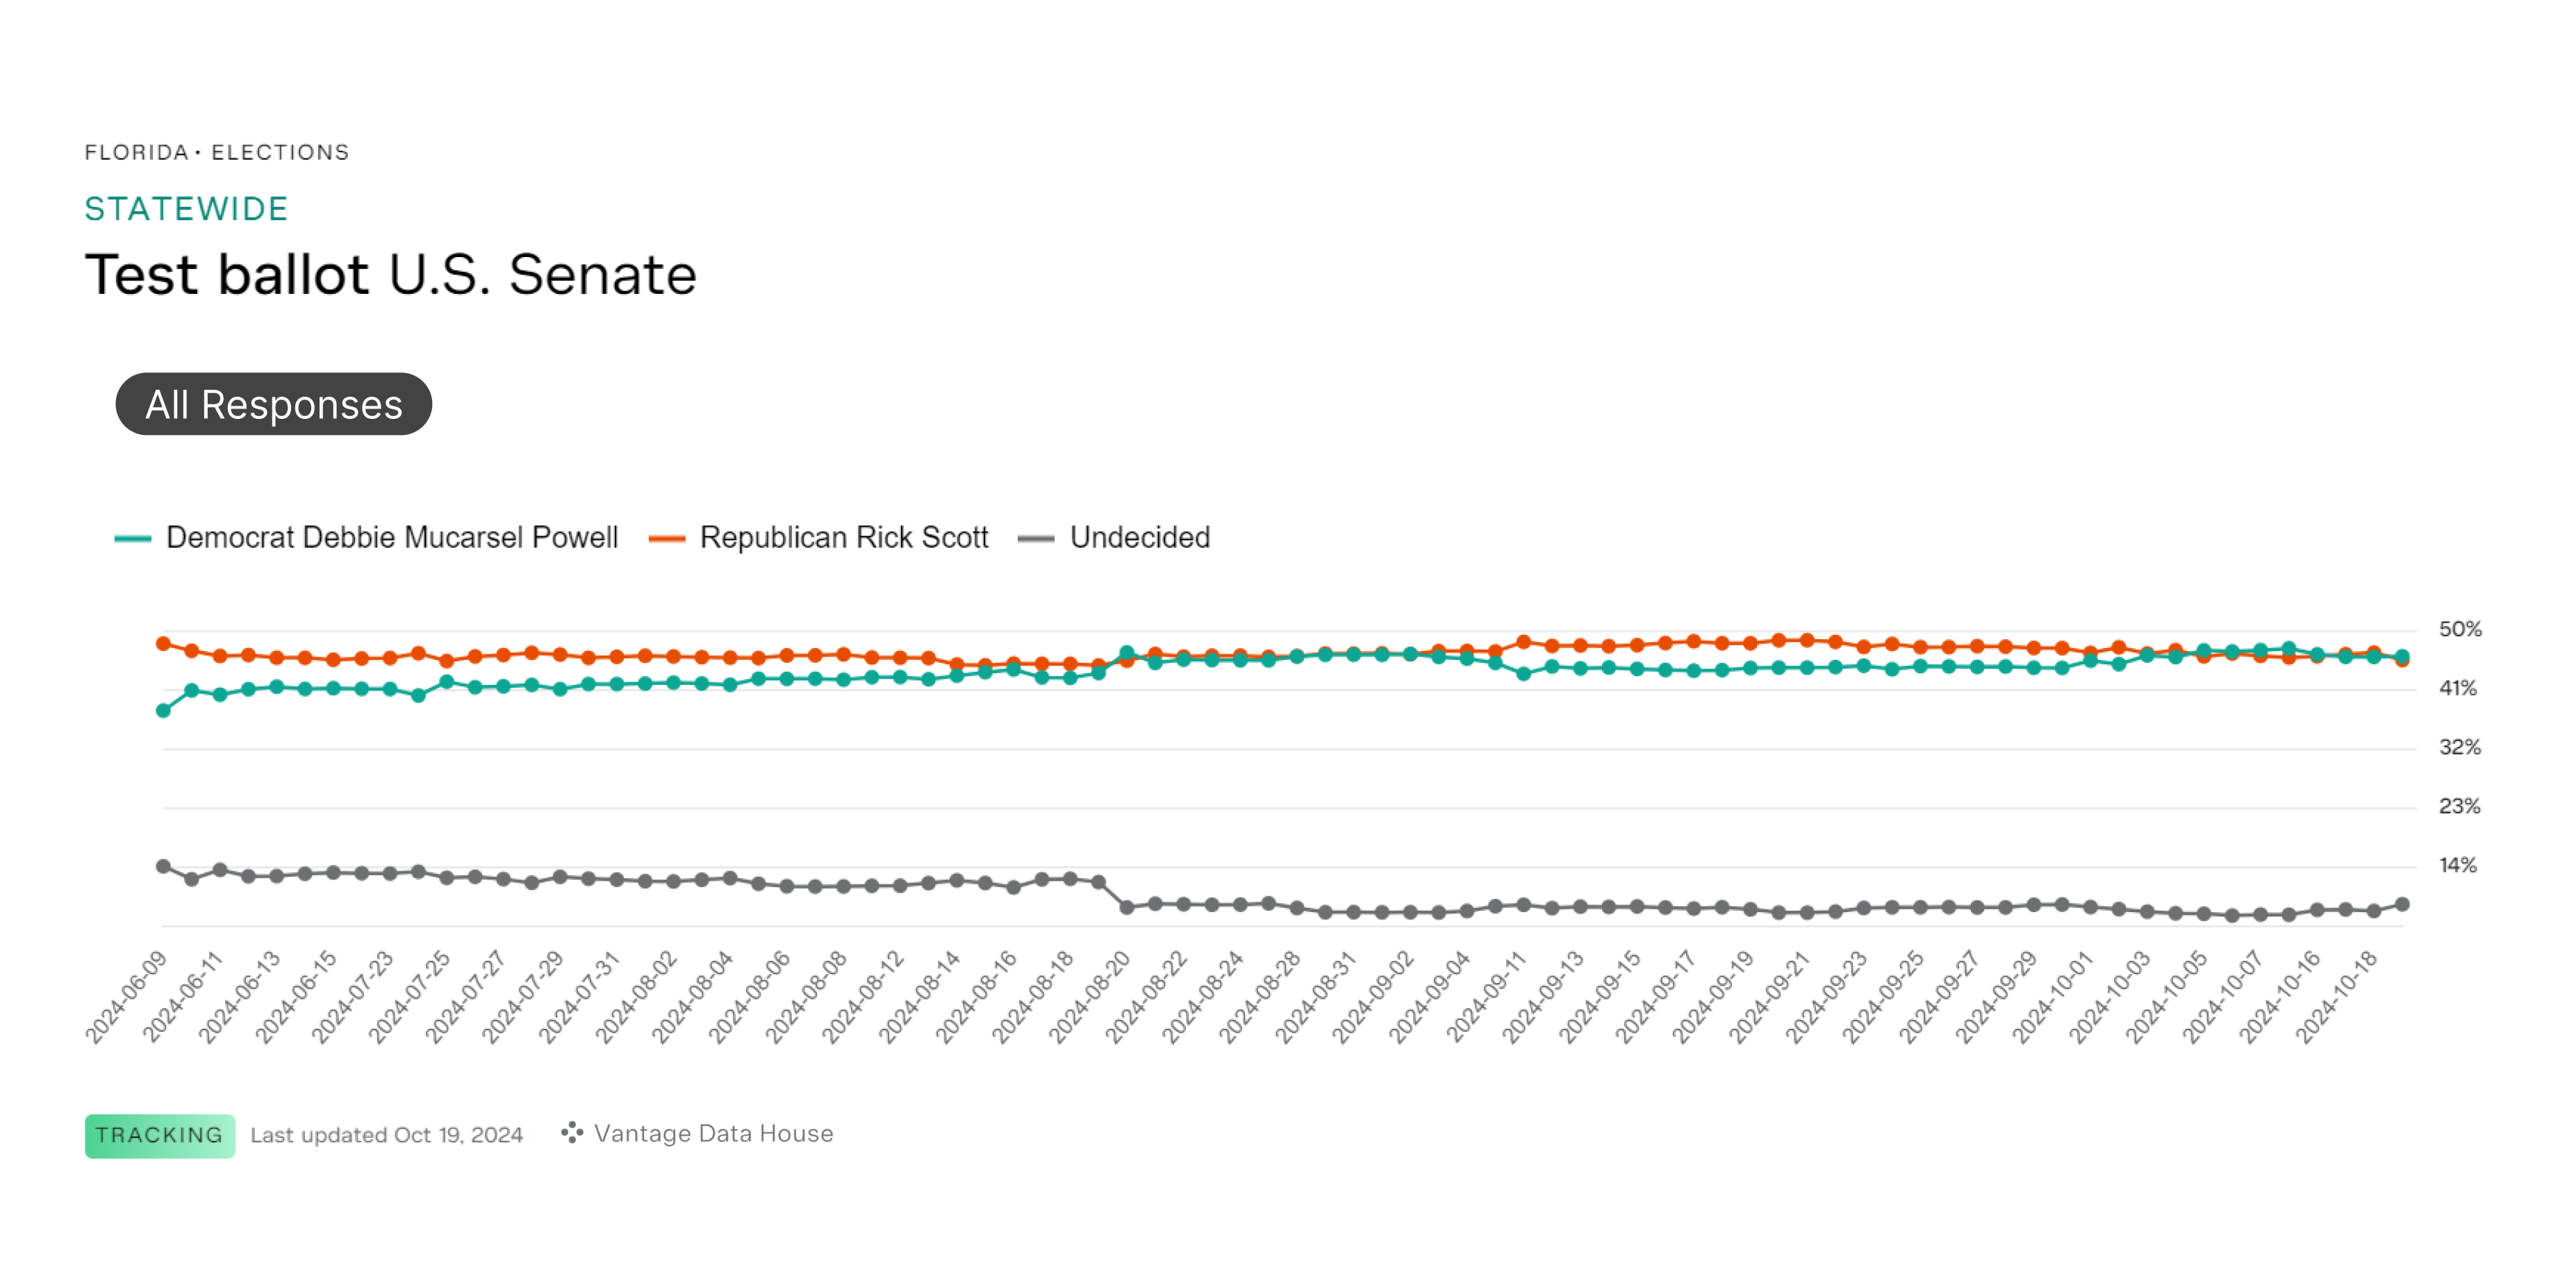
Scott v. Powell:
The Democratic Senatorial Campaign Committee is pouring millions into the state to take down Rick Scott. But they can’t do this without beating Trump, and they’re getting dangerously close to doing just that.
Conclusion
National polls showing a close race are irrelevant. The only polls that matter are those from the swing states where the electoral college will be decided. Both parties want to keep the perception of a close race to motivate their voters, so the narrative of a neck-and-neck race will persist until Election Day.
Whether it’s due to faulty polling, media spin, or a strategy designed to keep voters engaged, reality is starting to break through. This election could be shaping up to be a blowout, and it’s time to focus on the actual data—not just what we’re being told.


